Immigrants from Russia vs Zimbabwean 6th Grade
COMPARE
Immigrants from Russia
Zimbabwean
6th Grade
6th Grade Comparison
Immigrants from Russia
Zimbabweans
97.1%
6TH GRADE
67.6/ 100
METRIC RATING
157th/ 347
METRIC RANK
97.6%
6TH GRADE
99.1/ 100
METRIC RATING
82nd/ 347
METRIC RANK
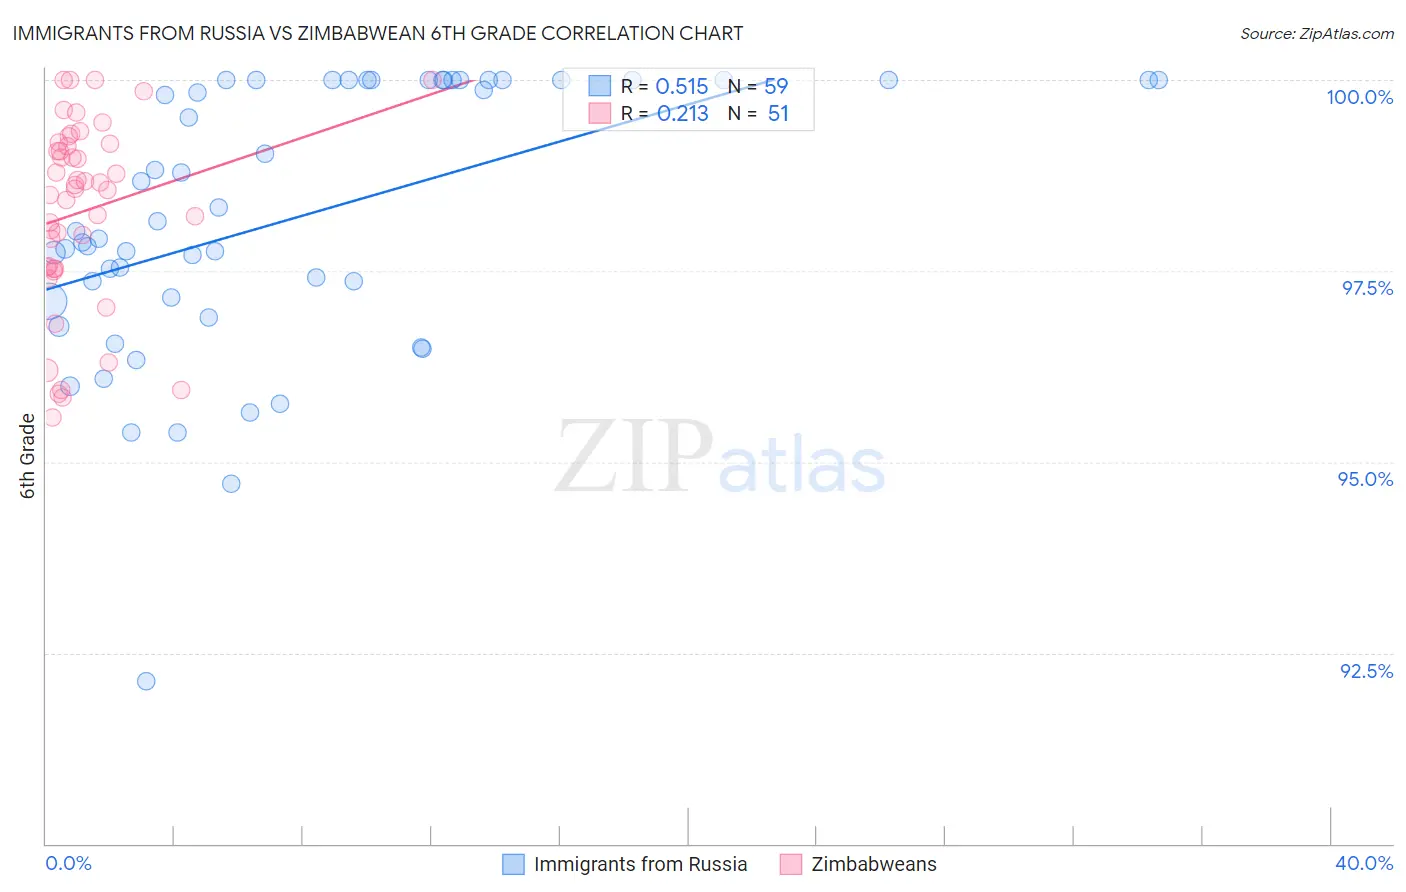
Immigrants from Russia vs Zimbabwean 6th Grade Correlation Chart
The statistical analysis conducted on geographies consisting of 347,948,494 people shows a substantial positive correlation between the proportion of Immigrants from Russia and percentage of population with at least 6th grade education in the United States with a correlation coefficient (R) of 0.515 and weighted average of 97.1%. Similarly, the statistical analysis conducted on geographies consisting of 69,203,423 people shows a weak positive correlation between the proportion of Zimbabweans and percentage of population with at least 6th grade education in the United States with a correlation coefficient (R) of 0.213 and weighted average of 97.6%, a difference of 0.46%.
6th Grade Correlation Summary
| Measurement | Immigrants from Russia | Zimbabwean |
| Minimum | 92.1% | 95.6% |
| Maximum | 100.0% | 100.0% |
| Range | 7.9% | 4.4% |
| Mean | 98.2% | 98.3% |
| Median | 98.0% | 98.6% |
| Interquartile 25% (IQ1) | 97.1% | 97.5% |
| Interquartile 75% (IQ3) | 100.0% | 99.2% |
| Interquartile Range (IQR) | 2.9% | 1.6% |
| Standard Deviation (Sample) | 1.8% | 1.2% |
| Standard Deviation (Population) | 1.8% | 1.2% |
Similar Demographics by 6th Grade
Demographics Similar to Immigrants from Russia by 6th Grade
In terms of 6th grade, the demographic groups most similar to Immigrants from Russia are Alsatian (97.1%, a difference of 0.010%), Soviet Union (97.2%, a difference of 0.020%), Ute (97.1%, a difference of 0.020%), Immigrants from Iran (97.1%, a difference of 0.020%), and Kenyan (97.1%, a difference of 0.020%).
| Demographics | Rating | Rank | 6th Grade |
| Immigrants | Bosnia and Herzegovina | 74.8 /100 | #150 | Good 97.2% |
| French American Indians | 74.0 /100 | #151 | Good 97.2% |
| Immigrants | Jordan | 73.0 /100 | #152 | Good 97.2% |
| Immigrants | Eastern Europe | 72.6 /100 | #153 | Good 97.2% |
| Soviet Union | 71.5 /100 | #154 | Good 97.2% |
| Ute | 71.1 /100 | #155 | Good 97.1% |
| Alsatians | 69.8 /100 | #156 | Good 97.1% |
| Immigrants | Russia | 67.6 /100 | #157 | Good 97.1% |
| Immigrants | Iran | 63.3 /100 | #158 | Good 97.1% |
| Kenyans | 62.9 /100 | #159 | Good 97.1% |
| Ugandans | 62.2 /100 | #160 | Good 97.1% |
| Immigrants | Belarus | 60.4 /100 | #161 | Good 97.1% |
| Marshallese | 60.2 /100 | #162 | Good 97.1% |
| Albanians | 57.8 /100 | #163 | Average 97.1% |
| Immigrants | Korea | 57.7 /100 | #164 | Average 97.1% |
Demographics Similar to Zimbabweans by 6th Grade
In terms of 6th grade, the demographic groups most similar to Zimbabweans are Lumbee (97.6%, a difference of 0.0%), Potawatomi (97.6%, a difference of 0.010%), Shoshone (97.6%, a difference of 0.010%), Immigrants from Lithuania (97.6%, a difference of 0.020%), and Icelander (97.6%, a difference of 0.020%).
| Demographics | Rating | Rank | 6th Grade |
| Ukrainians | 99.4 /100 | #75 | Exceptional 97.6% |
| Immigrants | England | 99.4 /100 | #76 | Exceptional 97.6% |
| Immigrants | Lithuania | 99.3 /100 | #77 | Exceptional 97.6% |
| Icelanders | 99.3 /100 | #78 | Exceptional 97.6% |
| Immigrants | India | 99.3 /100 | #79 | Exceptional 97.6% |
| Osage | 99.3 /100 | #80 | Exceptional 97.6% |
| Lumbee | 99.2 /100 | #81 | Exceptional 97.6% |
| Zimbabweans | 99.1 /100 | #82 | Exceptional 97.6% |
| Potawatomi | 99.1 /100 | #83 | Exceptional 97.6% |
| Shoshone | 99.0 /100 | #84 | Exceptional 97.6% |
| Delaware | 98.9 /100 | #85 | Exceptional 97.6% |
| Immigrants | Belgium | 98.9 /100 | #86 | Exceptional 97.5% |
| Puget Sound Salish | 98.9 /100 | #87 | Exceptional 97.5% |
| Immigrants | South Africa | 98.9 /100 | #88 | Exceptional 97.5% |
| Immigrants | Australia | 98.8 /100 | #89 | Exceptional 97.5% |