Immigrants from Russia vs Haitian 6th Grade

COMPARE

Immigrants from Russia
Race
Ancestry
AfghanAfricanAlaska NativeAlaskan AthabascanAlbanianAleutAlsatianAmericanApacheArabArapahoArgentineanArmenianAssyrian/Chaldean/SyriacAustralianAustrianBahamianBangladeshiBarbadianBasqueBelgianBelizeanBermudanBhutaneseBlackfeetBolivianBrazilianBritishBritish West IndianBulgarianBurmeseCajunCambodianCanadianCape VerdeanCarpatho RusynCelticCentral AmericanCentral American IndianCherokeeCheyenneChickasawChileanChineseChippewaChoctawColombianColvilleComancheCosta RicanCreeCreekCroatianCrowCubanCypriotCzechCzechoslovakianDanishDelawareDominicanDutchDutch West IndianEastern EuropeanEcuadorianEgyptianEnglishEstonianEthiopianEuropeanFijianFilipinoFinnishFrenchFrench American IndianFrench CanadianGermanGerman RussianGhanaianGreekGuamanian/ChamorroGuatemalanGuyaneseHmongHonduranHopiHoumaHungarianIcelanderIndian (Asian)IndonesianInupiatIranianIraqiIrishIroquoisIsraeliItalianJamaicanJapaneseJordanianKenyanKiowaKoreanLaotianLatvianLebaneseLiberianLithuanianLumbeeLuxembourgerMacedonianMalaysianMalteseMarshalleseMenomineeMexicanMexican American IndianMongolianMoroccanNative HawaiianNavajoNepaleseNew ZealanderNicaraguanNigerianNorthern EuropeanNorwegianOkinawanOsageOttawaPaiutePakistaniPalestinianPanamanianParaguayanPennsylvania GermanPeruvianPimaPolishPortuguesePotawatomiPuebloPuerto RicanPuget Sound SalishRomanianRussianSalvadoranSamoanScandinavianScotch-IrishScottishSeminoleSenegaleseSerbianShoshoneSierra LeoneanSiouxSlavicSlovakSloveneSomaliSouth AfricanSouth AmericanSouth American IndianSoviet UnionSpaniardSpanishSpanish AmericanSpanish American IndianSri LankanSubsaharan AfricanSudaneseSwedishSwissSyrianTaiwaneseThaiTlingit-HaidaTohono O'OdhamTonganTrinidadian and TobagonianTsimshianTurkishU.S. Virgin IslanderUgandanUkrainianUruguayanUteVenezuelanVietnameseWelshWest IndianYakamaYaquiYugoslavianYumanYup'ikZimbabwean
Immigration
NonimmigrantsImmigrantsAfghanistanAfricaAlbaniaArgentinaArmeniaAsiaAustraliaAustriaBahamasBangladeshBarbadosBelarusBelgiumBelizeBoliviaBosnia and HerzegovinaBrazilBulgariaBurma/MyanmarCabo VerdeCambodiaCameroonCanadaCaribbeanCentral AmericaChileChinaColombiaCongoCosta RicaCroatiaCubaCzechoslovakiaDenmarkDominicaDominican RepublicEastern AfricaEastern AsiaEastern EuropeEcuadorEgyptEl SalvadorEnglandEritreaEthiopiaEuropeFijiFranceGermanyGhanaGreeceGrenadaGuatemalaGuyanaHaitiHondurasHong KongHungaryIndiaIndonesiaIranIraqIrelandIsraelItalyJamaicaJapanJordanKazakhstanKenyaKoreaKuwaitLaosLatin AmericaLatviaLebanonLiberiaLithuaniaMalaysiaMexicoMicronesiaMiddle AfricaMoldovaMoroccoNepalNetherlandsNicaraguaNigeriaNorth AmericaNorth MacedoniaNorthern AfricaNorthern EuropeNorwayOceaniaPakistanPanamaPeruPhilippinesPolandPortugalRomaniaRussiaSaudi ArabiaScotlandSenegalSerbiaSierra LeoneSingaporeSomaliaSouth AfricaSouth AmericaSouth Central AsiaSouth Eastern AsiaSouthern EuropeSpainSri LankaSt. Vincent and the GrenadinesSudanSwedenSwitzerlandSyriaTaiwanThailandTrinidad and TobagoTurkeyUgandaUkraineUruguayUzbekistanVenezuelaVietnamWest IndiesWestern AfricaWestern AsiaWestern EuropeYemenZaireZimbabweAzores
Haitian
Race
Ancestry
AfghanAfricanAlaska NativeAlaskan AthabascanAlbanianAleutAlsatianAmericanApacheArabArapahoArgentineanArmenianAssyrian/Chaldean/SyriacAustralianAustrianBahamianBangladeshiBarbadianBasqueBelgianBelizeanBermudanBhutaneseBlackfeetBolivianBrazilianBritishBritish West IndianBulgarianBurmeseCajunCambodianCanadianCape VerdeanCarpatho RusynCelticCentral AmericanCentral American IndianCherokeeCheyenneChickasawChileanChineseChippewaChoctawColombianColvilleComancheCosta RicanCreeCreekCroatianCrowCubanCypriotCzechCzechoslovakianDanishDelawareDominicanDutchDutch West IndianEastern EuropeanEcuadorianEgyptianEnglishEstonianEthiopianEuropeanFijianFilipinoFinnishFrenchFrench American IndianFrench CanadianGermanGerman RussianGhanaianGreekGuamanian/ChamorroGuatemalanGuyaneseHaitianHmongHonduranHopiHoumaHungarianIcelanderIndian (Asian)IndonesianInupiatIranianIraqiIrishIroquoisIsraeliItalianJamaicanJapaneseJordanianKenyanKiowaKoreanLaotianLatvianLebaneseLiberianLithuanianLumbeeLuxembourgerMacedonianMalaysianMalteseMarshalleseMenomineeMexicanMexican American IndianMongolianMoroccanNative HawaiianNavajoNepaleseNew ZealanderNicaraguanNigerianNorthern EuropeanNorwegianOkinawanOsageOttawaPaiutePakistaniPalestinianPanamanianParaguayanPennsylvania GermanPeruvianPimaPolishPortuguesePotawatomiPuebloPuerto RicanPuget Sound SalishRomanianRussianSalvadoranSamoanScandinavianScotch-IrishScottishSeminoleSenegaleseSerbianShoshoneSierra LeoneanSiouxSlavicSlovakSloveneSomaliSouth AfricanSouth AmericanSouth American IndianSoviet UnionSpaniardSpanishSpanish AmericanSpanish American IndianSri LankanSubsaharan AfricanSudaneseSwedishSwissSyrianTaiwaneseThaiTlingit-HaidaTohono O'OdhamTonganTrinidadian and TobagonianTsimshianTurkishU.S. Virgin IslanderUgandanUkrainianUruguayanUteVenezuelanVietnameseWelshWest IndianYakamaYaquiYugoslavianYumanYup'ikZimbabwean
Immigration
NonimmigrantsImmigrantsAfghanistanAfricaAlbaniaArgentinaArmeniaAsiaAustraliaAustriaBahamasBangladeshBarbadosBelarusBelgiumBelizeBoliviaBosnia and HerzegovinaBrazilBulgariaBurma/MyanmarCabo VerdeCambodiaCameroonCanadaCaribbeanCentral AmericaChileChinaColombiaCongoCosta RicaCroatiaCubaCzechoslovakiaDenmarkDominicaDominican RepublicEastern AfricaEastern AsiaEastern EuropeEcuadorEgyptEl SalvadorEnglandEritreaEthiopiaEuropeFijiFranceGermanyGhanaGreeceGrenadaGuatemalaGuyanaHaitiHondurasHong KongHungaryIndiaIndonesiaIranIraqIrelandIsraelItalyJamaicaJapanJordanKazakhstanKenyaKoreaKuwaitLaosLatin AmericaLatviaLebanonLiberiaLithuaniaMalaysiaMexicoMicronesiaMiddle AfricaMoldovaMoroccoNepalNetherlandsNicaraguaNigeriaNorth AmericaNorth MacedoniaNorthern AfricaNorthern EuropeNorwayOceaniaPakistanPanamaPeruPhilippinesPolandPortugalRomaniaSaudi ArabiaScotlandSenegalSerbiaSierra LeoneSingaporeSomaliaSouth AfricaSouth AmericaSouth Central AsiaSouth Eastern AsiaSouthern EuropeSpainSri LankaSt. Vincent and the GrenadinesSudanSwedenSwitzerlandSyriaTaiwanThailandTrinidad and TobagoTurkeyUgandaUkraineUruguayUzbekistanVenezuelaVietnamWest IndiesWestern AfricaWestern AsiaWestern EuropeYemenZaireZimbabweAzores
6th Grade
Income
Poverty
Unemployment
Labor Participation
Family Structure
Vehicle Availability
Education Level
Disability

6th Grade Comparison

Immigrants from Russia

Haitians

Good
Tragic
97.1%
6TH GRADE
67.6/ 100
METRIC RATING
157th/ 347
METRIC RANK
95.8%
6TH GRADE
0.0/ 100
METRIC RATING
297th/ 347
METRIC RANK

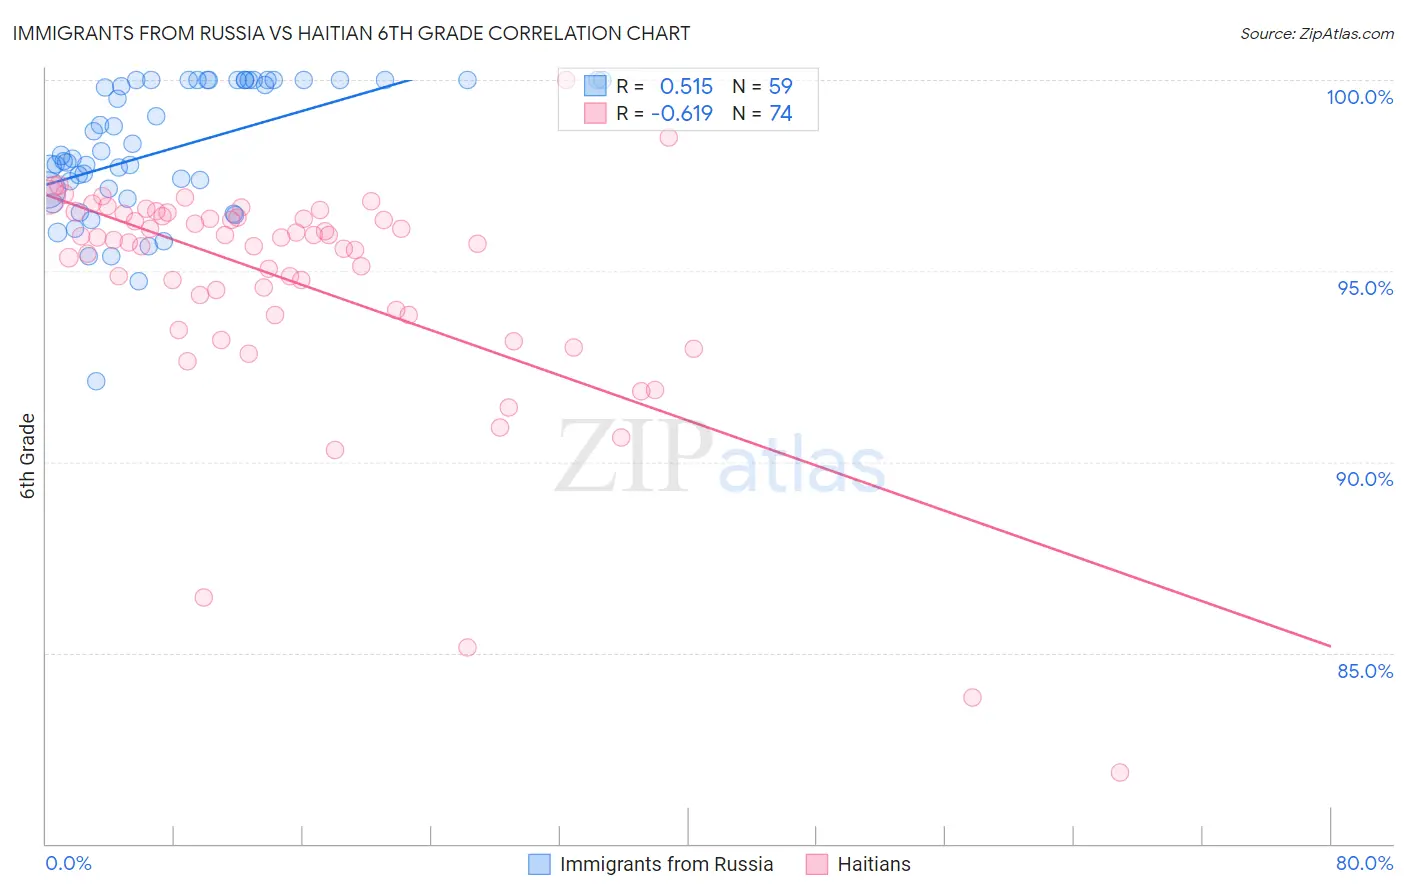
Immigrants from Russia vs Haitian 6th Grade Correlation Chart

The statistical analysis conducted on geographies consisting of 347,948,494 people shows a substantial positive correlation between the proportion of Immigrants from Russia and percentage of population with at least 6th grade education in the United States with a correlation coefficient (R) of 0.515 and weighted average of 97.1%. Similarly, the statistical analysis conducted on geographies consisting of 288,018,742 people shows a significant negative correlation between the proportion of Haitians and percentage of population with at least 6th grade education in the United States with a correlation coefficient (R) of -0.619 and weighted average of 95.8%, a difference of 1.4%.
Immigrants from Russia vs Haitian 6th Grade

6th Grade Correlation Summary

MeasurementImmigrants from RussiaHaitian
Minimum92.1%81.9%
Maximum100.0%100.0%
Range7.9%18.1%
Mean98.2%94.7%
Median98.0%95.8%
Interquartile 25% (IQ1)97.1%93.8%
Interquartile 75% (IQ3)100.0%96.4%
Interquartile Range (IQR)2.9%2.6%
Standard Deviation (Sample)1.8%3.1%
Standard Deviation (Population)1.8%3.1%

Similar Demographics by 6th Grade

Demographics Similar to Immigrants from Russia by 6th Grade

In terms of 6th grade, the demographic groups most similar to Immigrants from Russia are Alsatian (97.1%, a difference of 0.010%), Soviet Union (97.2%, a difference of 0.020%), Ute (97.1%, a difference of 0.020%), Immigrants from Iran (97.1%, a difference of 0.020%), and Kenyan (97.1%, a difference of 0.020%).
DemographicsRating | Rank6th Grade
Immigrants | Bosnia and Herzegovina
74.8
/100
|
#150
Good
97.2%
French American Indians
74.0
/100
|
#151
Good
97.2%
Immigrants | Jordan
73.0
/100
|
#152
Good
97.2%
Immigrants | Eastern Europe
72.6
/100
|
#153
Good
97.2%
Soviet Union
71.5
/100
|
#154
Good
97.2%
Ute
71.1
/100
|
#155
Good
97.1%
Alsatians
69.8
/100
|
#156
Good
97.1%
Immigrants | Russia
67.6
/100
|
#157
Good
97.1%
Immigrants | Iran
63.3
/100
|
#158
Good
97.1%
Kenyans
62.9
/100
|
#159
Good
97.1%
Ugandans
62.2
/100
|
#160
Good
97.1%
Immigrants | Belarus
60.4
/100
|
#161
Good
97.1%
Marshallese
60.2
/100
|
#162
Good
97.1%
Albanians
57.8
/100
|
#163
Average
97.1%
Immigrants | Korea
57.7
/100
|
#164
Average
97.1%

Demographics Similar to Haitians by 6th Grade

In terms of 6th grade, the demographic groups most similar to Haitians are Sri Lankan (95.8%, a difference of 0.070%), Immigrants from Laos (95.7%, a difference of 0.080%), Immigrants from Dominica (95.7%, a difference of 0.090%), Immigrants (95.7%, a difference of 0.10%), and Immigrants from South Eastern Asia (95.9%, a difference of 0.11%).
DemographicsRating | Rank6th Grade
Immigrants | Somalia
0.0
/100
|
#290
Tragic
96.1%
Immigrants | St. Vincent and the Grenadines
0.0
/100
|
#291
Tragic
96.1%
Immigrants | Barbados
0.0
/100
|
#292
Tragic
96.1%
Immigrants | West Indies
0.0
/100
|
#293
Tragic
96.1%
British West Indians
0.0
/100
|
#294
Tragic
96.0%
Immigrants | Grenada
0.0
/100
|
#295
Tragic
95.9%
Immigrants | South Eastern Asia
0.0
/100
|
#296
Tragic
95.9%
Haitians
0.0
/100
|
#297
Tragic
95.8%
Sri Lankans
0.0
/100
|
#298
Tragic
95.8%
Immigrants | Laos
0.0
/100
|
#299
Tragic
95.7%
Immigrants | Dominica
0.0
/100
|
#300
Tragic
95.7%
Immigrants | Immigrants
0.0
/100
|
#301
Tragic
95.7%
Immigrants | Burma/Myanmar
0.0
/100
|
#302
Tragic
95.7%
Bangladeshis
0.0
/100
|
#303
Tragic
95.7%
Indonesians
0.0
/100
|
#304
Tragic
95.6%