Immigrants from Russia vs Alaskan Athabascan 4th Grade
COMPARE
Immigrants from Russia
Alaskan Athabascan
4th Grade
4th Grade Comparison
Immigrants from Russia
Alaskan Athabascans
97.6%
4TH GRADE
67.0/ 100
METRIC RATING
154th/ 347
METRIC RANK
98.4%
4TH GRADE
100.0/ 100
METRIC RATING
10th/ 347
METRIC RANK
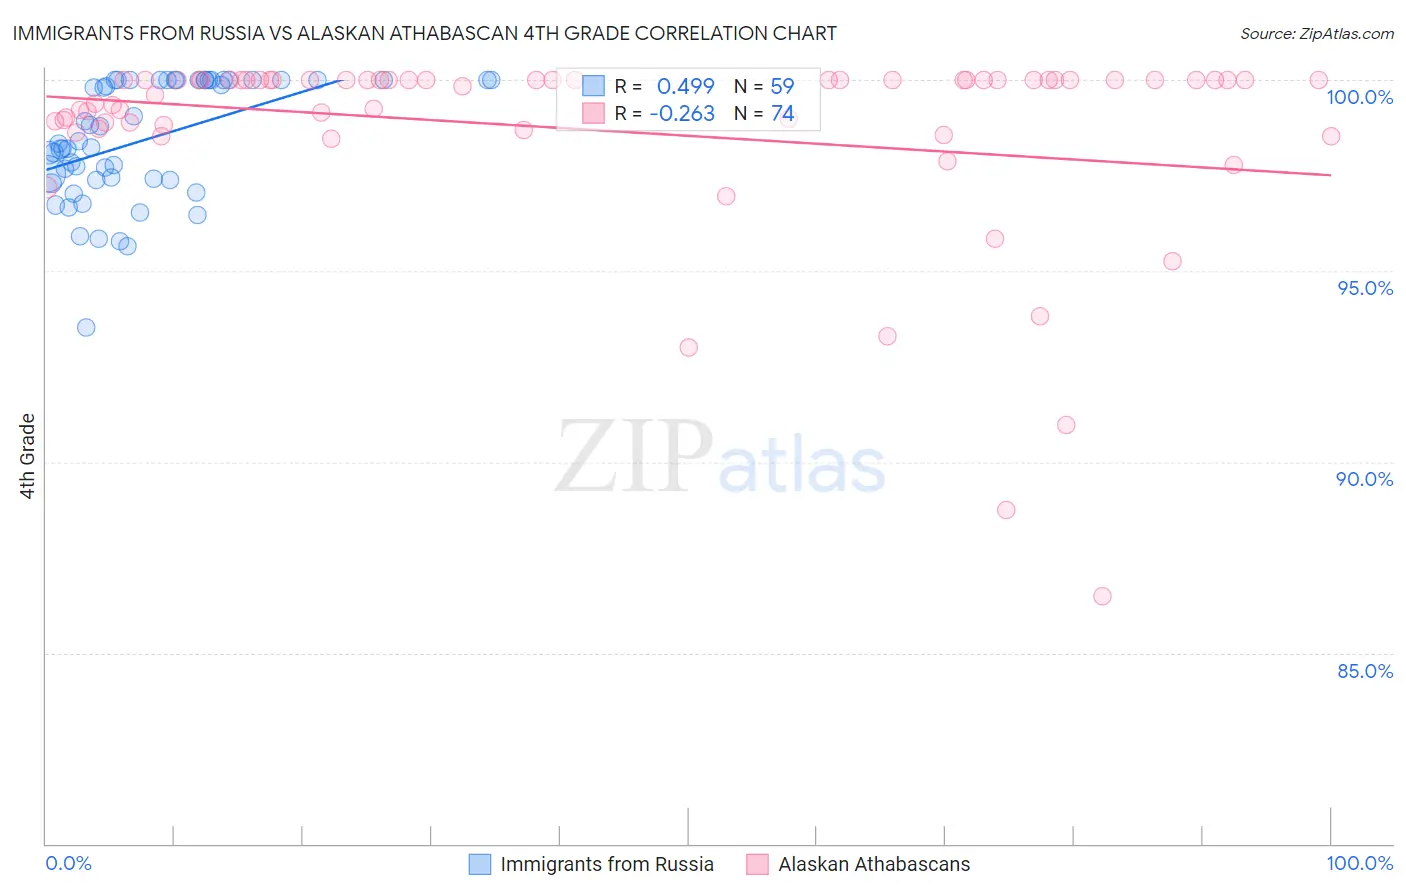
Immigrants from Russia vs Alaskan Athabascan 4th Grade Correlation Chart
The statistical analysis conducted on geographies consisting of 347,948,494 people shows a moderate positive correlation between the proportion of Immigrants from Russia and percentage of population with at least 4th grade education in the United States with a correlation coefficient (R) of 0.499 and weighted average of 97.6%. Similarly, the statistical analysis conducted on geographies consisting of 45,820,365 people shows a weak negative correlation between the proportion of Alaskan Athabascans and percentage of population with at least 4th grade education in the United States with a correlation coefficient (R) of -0.263 and weighted average of 98.4%, a difference of 0.86%.
4th Grade Correlation Summary
| Measurement | Immigrants from Russia | Alaskan Athabascan |
| Minimum | 93.5% | 86.5% |
| Maximum | 100.0% | 100.0% |
| Range | 6.5% | 13.5% |
| Mean | 98.4% | 98.7% |
| Median | 98.3% | 100.0% |
| Interquartile 25% (IQ1) | 97.4% | 98.7% |
| Interquartile 75% (IQ3) | 100.0% | 100.0% |
| Interquartile Range (IQR) | 2.6% | 1.3% |
| Standard Deviation (Sample) | 1.6% | 2.6% |
| Standard Deviation (Population) | 1.5% | 2.6% |
Similar Demographics by 4th Grade
Demographics Similar to Immigrants from Russia by 4th Grade
In terms of 4th grade, the demographic groups most similar to Immigrants from Russia are Albanian (97.6%, a difference of 0.0%), Immigrants from Jordan (97.6%, a difference of 0.0%), Immigrants from Bosnia and Herzegovina (97.6%, a difference of 0.0%), French American Indian (97.6%, a difference of 0.0%), and Immigrants from Italy (97.6%, a difference of 0.010%).
| Demographics | Rating | Rank | 4th Grade |
| Ute | 80.6 /100 | #147 | Excellent 97.7% |
| Hopi | 80.6 /100 | #148 | Excellent 97.7% |
| Soviet Union | 77.8 /100 | #149 | Good 97.6% |
| Immigrants | Israel | 77.7 /100 | #150 | Good 97.6% |
| Alsatians | 77.2 /100 | #151 | Good 97.6% |
| Immigrants | South Central Asia | 76.2 /100 | #152 | Good 97.6% |
| Immigrants | Eastern Europe | 71.3 /100 | #153 | Good 97.6% |
| Immigrants | Russia | 67.0 /100 | #154 | Good 97.6% |
| Albanians | 67.0 /100 | #155 | Good 97.6% |
| Immigrants | Jordan | 66.9 /100 | #156 | Good 97.6% |
| Immigrants | Bosnia and Herzegovina | 66.0 /100 | #157 | Good 97.6% |
| French American Indians | 65.9 /100 | #158 | Good 97.6% |
| Immigrants | Italy | 63.7 /100 | #159 | Good 97.6% |
| Apache | 61.3 /100 | #160 | Good 97.6% |
| Marshallese | 60.8 /100 | #161 | Good 97.6% |
Demographics Similar to Alaskan Athabascans by 4th Grade
In terms of 4th grade, the demographic groups most similar to Alaskan Athabascans are English (98.4%, a difference of 0.010%), Tlingit-Haida (98.4%, a difference of 0.010%), Swedish (98.4%, a difference of 0.010%), Slovene (98.4%, a difference of 0.020%), and Carpatho Rusyn (98.4%, a difference of 0.020%).
| Demographics | Rating | Rank | 4th Grade |
| Tsimshian | 100.0 /100 | #3 | Exceptional 98.6% |
| Inupiat | 100.0 /100 | #4 | Exceptional 98.6% |
| Yup'ik | 100.0 /100 | #5 | Exceptional 98.5% |
| Norwegians | 100.0 /100 | #6 | Exceptional 98.5% |
| Slovaks | 100.0 /100 | #7 | Exceptional 98.5% |
| Germans | 100.0 /100 | #8 | Exceptional 98.5% |
| Slovenes | 100.0 /100 | #9 | Exceptional 98.4% |
| Alaskan Athabascans | 100.0 /100 | #10 | Exceptional 98.4% |
| English | 100.0 /100 | #11 | Exceptional 98.4% |
| Tlingit-Haida | 100.0 /100 | #12 | Exceptional 98.4% |
| Swedes | 100.0 /100 | #13 | Exceptional 98.4% |
| Carpatho Rusyns | 100.0 /100 | #14 | Exceptional 98.4% |
| Dutch | 100.0 /100 | #15 | Exceptional 98.4% |
| Scottish | 100.0 /100 | #16 | Exceptional 98.4% |
| Pennsylvania Germans | 100.0 /100 | #17 | Exceptional 98.4% |