Immigrants from Philippines vs Alaskan Athabascan 4th Grade
COMPARE
Immigrants from Philippines
Alaskan Athabascan
4th Grade
4th Grade Comparison
Immigrants from Philippines
Alaskan Athabascans
96.8%
4TH GRADE
0.1/ 100
METRIC RATING
283rd/ 347
METRIC RANK
98.4%
4TH GRADE
100.0/ 100
METRIC RATING
10th/ 347
METRIC RANK
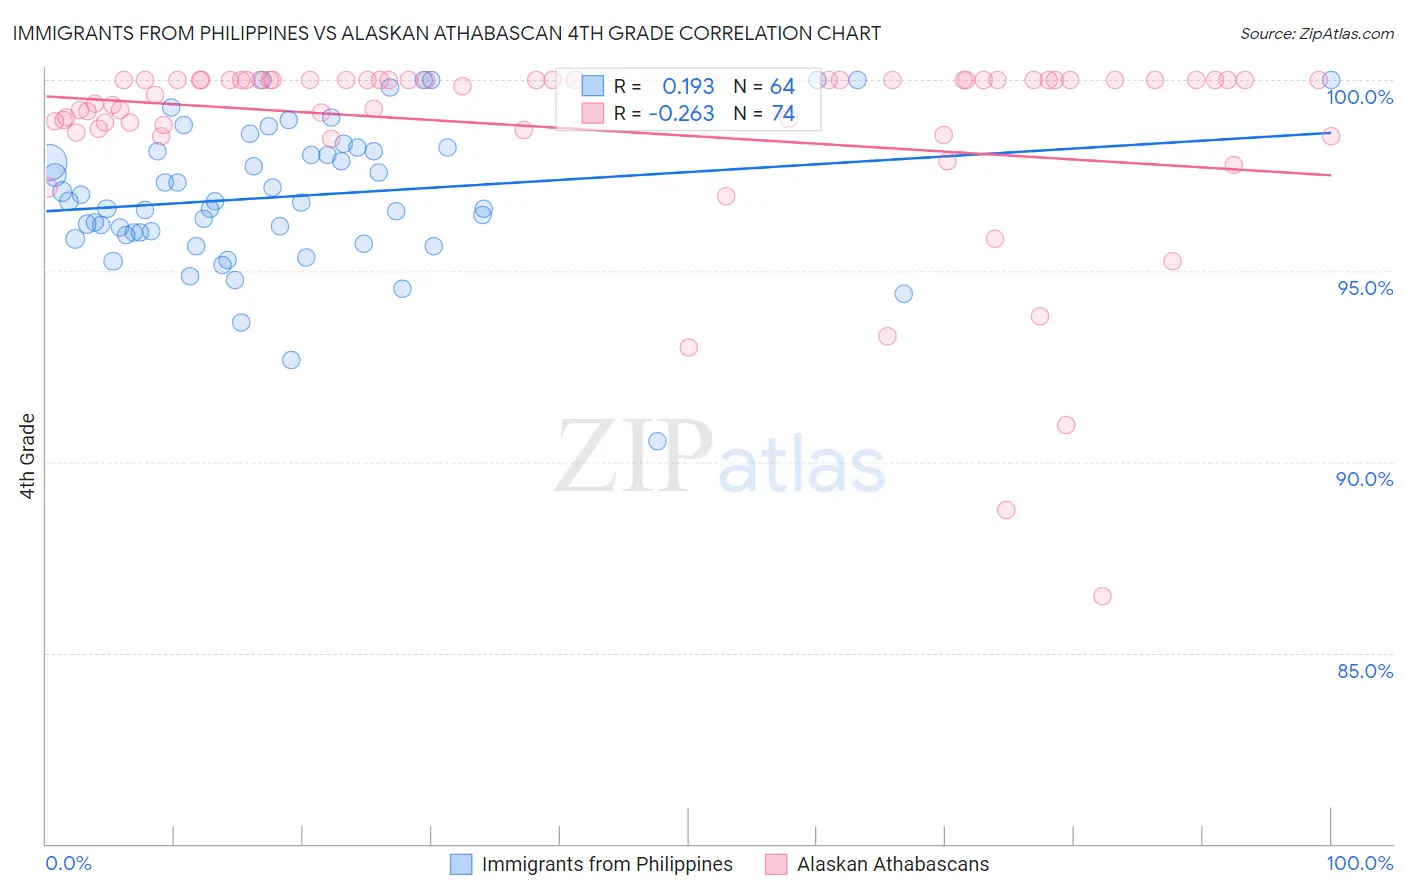
Immigrants from Philippines vs Alaskan Athabascan 4th Grade Correlation Chart
The statistical analysis conducted on geographies consisting of 471,303,531 people shows a poor positive correlation between the proportion of Immigrants from Philippines and percentage of population with at least 4th grade education in the United States with a correlation coefficient (R) of 0.193 and weighted average of 96.8%. Similarly, the statistical analysis conducted on geographies consisting of 45,820,365 people shows a weak negative correlation between the proportion of Alaskan Athabascans and percentage of population with at least 4th grade education in the United States with a correlation coefficient (R) of -0.263 and weighted average of 98.4%, a difference of 1.6%.
4th Grade Correlation Summary
| Measurement | Immigrants from Philippines | Alaskan Athabascan |
| Minimum | 90.6% | 86.5% |
| Maximum | 100.0% | 100.0% |
| Range | 9.4% | 13.5% |
| Mean | 97.0% | 98.7% |
| Median | 96.8% | 100.0% |
| Interquartile 25% (IQ1) | 96.0% | 98.7% |
| Interquartile 75% (IQ3) | 98.2% | 100.0% |
| Interquartile Range (IQR) | 2.2% | 1.3% |
| Standard Deviation (Sample) | 1.9% | 2.6% |
| Standard Deviation (Population) | 1.8% | 2.6% |
Similar Demographics by 4th Grade
Demographics Similar to Immigrants from Philippines by 4th Grade
In terms of 4th grade, the demographic groups most similar to Immigrants from Philippines are Immigrants from Hong Kong (96.9%, a difference of 0.0%), Immigrants from Trinidad and Tobago (96.8%, a difference of 0.0%), Barbadian (96.9%, a difference of 0.020%), Immigrants from St. Vincent and the Grenadines (96.8%, a difference of 0.020%), and Immigrants from Bolivia (96.9%, a difference of 0.030%).
| Demographics | Rating | Rank | 4th Grade |
| Yaqui | 0.1 /100 | #276 | Tragic 96.9% |
| Immigrants | Western Africa | 0.1 /100 | #277 | Tragic 96.9% |
| Immigrants | Bolivia | 0.1 /100 | #278 | Tragic 96.9% |
| Afghans | 0.1 /100 | #279 | Tragic 96.9% |
| Barbadians | 0.1 /100 | #280 | Tragic 96.9% |
| Immigrants | Hong Kong | 0.1 /100 | #281 | Tragic 96.9% |
| Immigrants | Trinidad and Tobago | 0.1 /100 | #282 | Tragic 96.8% |
| Immigrants | Philippines | 0.1 /100 | #283 | Tragic 96.8% |
| Immigrants | St. Vincent and the Grenadines | 0.1 /100 | #284 | Tragic 96.8% |
| Immigrants | Barbados | 0.0 /100 | #285 | Tragic 96.8% |
| Immigrants | Thailand | 0.0 /100 | #286 | Tragic 96.8% |
| Houma | 0.0 /100 | #287 | Tragic 96.8% |
| Immigrants | Afghanistan | 0.0 /100 | #288 | Tragic 96.8% |
| Immigrants | West Indies | 0.0 /100 | #289 | Tragic 96.7% |
| British West Indians | 0.0 /100 | #290 | Tragic 96.7% |
Demographics Similar to Alaskan Athabascans by 4th Grade
In terms of 4th grade, the demographic groups most similar to Alaskan Athabascans are English (98.4%, a difference of 0.010%), Tlingit-Haida (98.4%, a difference of 0.010%), Swedish (98.4%, a difference of 0.010%), Slovene (98.4%, a difference of 0.020%), and Carpatho Rusyn (98.4%, a difference of 0.020%).
| Demographics | Rating | Rank | 4th Grade |
| Tsimshian | 100.0 /100 | #3 | Exceptional 98.6% |
| Inupiat | 100.0 /100 | #4 | Exceptional 98.6% |
| Yup'ik | 100.0 /100 | #5 | Exceptional 98.5% |
| Norwegians | 100.0 /100 | #6 | Exceptional 98.5% |
| Slovaks | 100.0 /100 | #7 | Exceptional 98.5% |
| Germans | 100.0 /100 | #8 | Exceptional 98.5% |
| Slovenes | 100.0 /100 | #9 | Exceptional 98.4% |
| Alaskan Athabascans | 100.0 /100 | #10 | Exceptional 98.4% |
| English | 100.0 /100 | #11 | Exceptional 98.4% |
| Tlingit-Haida | 100.0 /100 | #12 | Exceptional 98.4% |
| Swedes | 100.0 /100 | #13 | Exceptional 98.4% |
| Carpatho Rusyns | 100.0 /100 | #14 | Exceptional 98.4% |
| Dutch | 100.0 /100 | #15 | Exceptional 98.4% |
| Scottish | 100.0 /100 | #16 | Exceptional 98.4% |
| Pennsylvania Germans | 100.0 /100 | #17 | Exceptional 98.4% |