Immigrants from Romania vs Immigrants from Western Asia Doctorate Degree
COMPARE
Immigrants from Romania
Immigrants from Western Asia
Doctorate Degree
Doctorate Degree Comparison
Immigrants from Romania
Immigrants from Western Asia
2.1%
DOCTORATE DEGREE
98.7/ 100
METRIC RATING
95th/ 347
METRIC RANK
2.2%
DOCTORATE DEGREE
99.8/ 100
METRIC RATING
75th/ 347
METRIC RANK
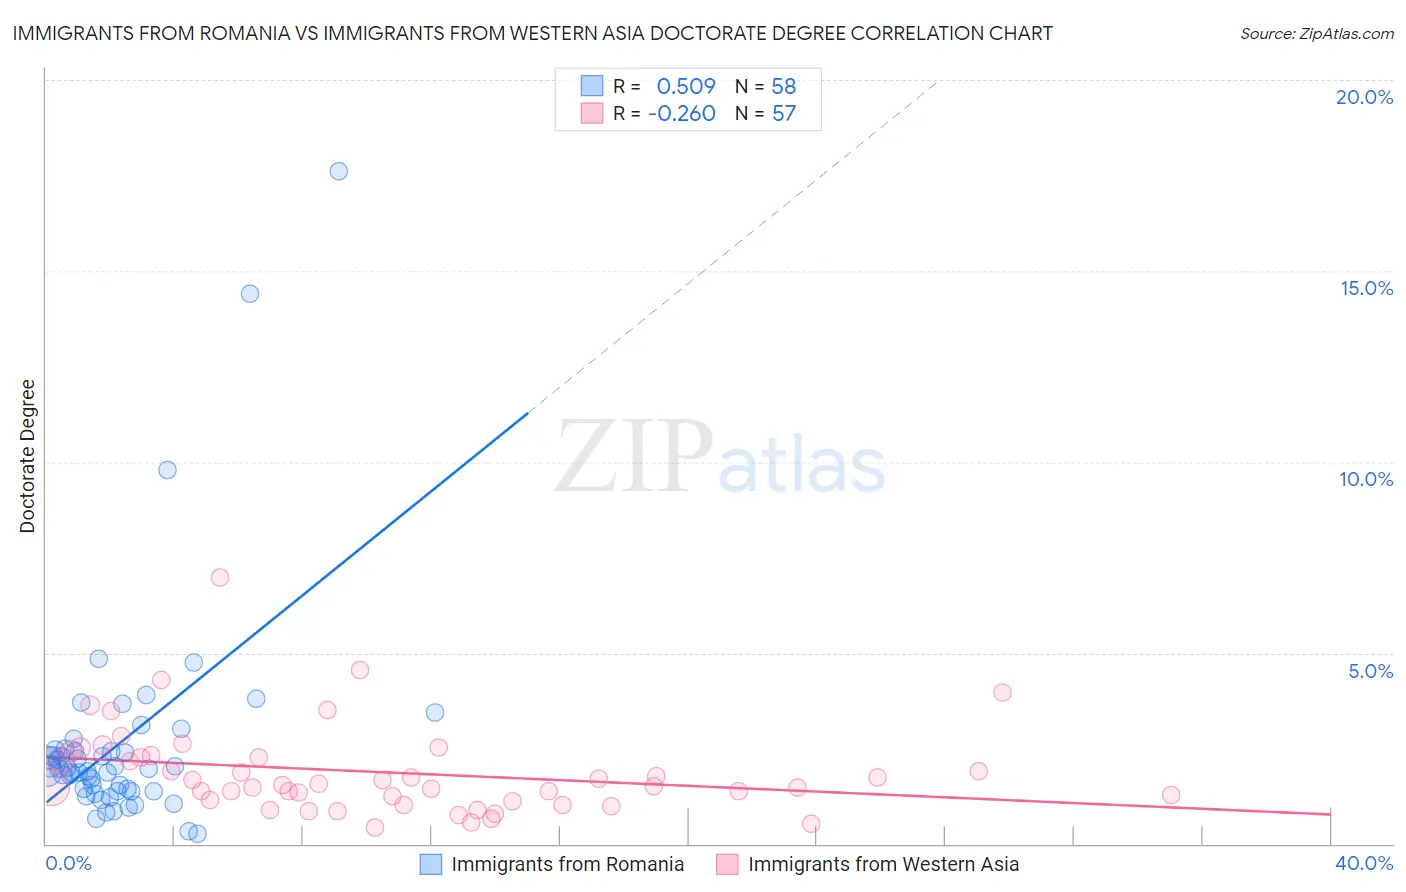
Immigrants from Romania vs Immigrants from Western Asia Doctorate Degree Correlation Chart
The statistical analysis conducted on geographies consisting of 256,246,165 people shows a substantial positive correlation between the proportion of Immigrants from Romania and percentage of population with at least doctorate degree education in the United States with a correlation coefficient (R) of 0.509 and weighted average of 2.1%. Similarly, the statistical analysis conducted on geographies consisting of 401,633,885 people shows a weak negative correlation between the proportion of Immigrants from Western Asia and percentage of population with at least doctorate degree education in the United States with a correlation coefficient (R) of -0.260 and weighted average of 2.2%, a difference of 5.5%.
Doctorate Degree Correlation Summary
| Measurement | Immigrants from Romania | Immigrants from Western Asia |
| Minimum | 0.25% | 0.43% |
| Maximum | 17.6% | 7.0% |
| Range | 17.4% | 6.5% |
| Mean | 2.7% | 1.9% |
| Median | 2.0% | 1.6% |
| Interquartile 25% (IQ1) | 1.4% | 1.1% |
| Interquartile 75% (IQ3) | 2.4% | 2.3% |
| Interquartile Range (IQR) | 1.1% | 1.2% |
| Standard Deviation (Sample) | 2.9% | 1.2% |
| Standard Deviation (Population) | 2.9% | 1.2% |
Demographics Similar to Immigrants from Romania and Immigrants from Western Asia by Doctorate Degree
In terms of doctorate degree, the demographic groups most similar to Immigrants from Romania are Greek (2.1%, a difference of 0.15%), Alsatian (2.1%, a difference of 0.78%), Chilean (2.2%, a difference of 1.0%), Immigrants from Sudan (2.2%, a difference of 1.3%), and Immigrants from Scotland (2.2%, a difference of 1.7%). Similarly, the demographic groups most similar to Immigrants from Western Asia are Immigrants from Hungary (2.2%, a difference of 0.070%), Immigrants from Lebanon (2.2%, a difference of 0.080%), Immigrants from Belarus (2.2%, a difference of 0.60%), Northern European (2.2%, a difference of 0.67%), and Ugandan (2.2%, a difference of 0.95%).
| Demographics | Rating | Rank | Doctorate Degree |
| Immigrants | Western Asia | 99.8 /100 | #75 | Exceptional 2.2% |
| Immigrants | Hungary | 99.8 /100 | #76 | Exceptional 2.2% |
| Immigrants | Lebanon | 99.8 /100 | #77 | Exceptional 2.2% |
| Immigrants | Belarus | 99.7 /100 | #78 | Exceptional 2.2% |
| Northern Europeans | 99.7 /100 | #79 | Exceptional 2.2% |
| Ugandans | 99.7 /100 | #80 | Exceptional 2.2% |
| Immigrants | Argentina | 99.7 /100 | #81 | Exceptional 2.2% |
| Immigrants | Uganda | 99.6 /100 | #82 | Exceptional 2.2% |
| Immigrants | Lithuania | 99.6 /100 | #83 | Exceptional 2.2% |
| Immigrants | England | 99.6 /100 | #84 | Exceptional 2.2% |
| Immigrants | Brazil | 99.6 /100 | #85 | Exceptional 2.2% |
| Egyptians | 99.4 /100 | #86 | Exceptional 2.2% |
| Immigrants | Zimbabwe | 99.4 /100 | #87 | Exceptional 2.2% |
| Immigrants | Nepal | 99.3 /100 | #88 | Exceptional 2.2% |
| British | 99.3 /100 | #89 | Exceptional 2.2% |
| Immigrants | Scotland | 99.2 /100 | #90 | Exceptional 2.2% |
| Immigrants | Sudan | 99.1 /100 | #91 | Exceptional 2.2% |
| Chileans | 99.1 /100 | #92 | Exceptional 2.2% |
| Alsatians | 99.0 /100 | #93 | Exceptional 2.1% |
| Greeks | 98.8 /100 | #94 | Exceptional 2.1% |
| Immigrants | Romania | 98.7 /100 | #95 | Exceptional 2.1% |