Croatian vs Immigrants from Western Asia Doctorate Degree
COMPARE
Croatian
Immigrants from Western Asia
Doctorate Degree
Doctorate Degree Comparison
Croatians
Immigrants from Western Asia
2.0%
DOCTORATE DEGREE
94.0/ 100
METRIC RATING
123rd/ 347
METRIC RANK
2.2%
DOCTORATE DEGREE
99.8/ 100
METRIC RATING
75th/ 347
METRIC RANK
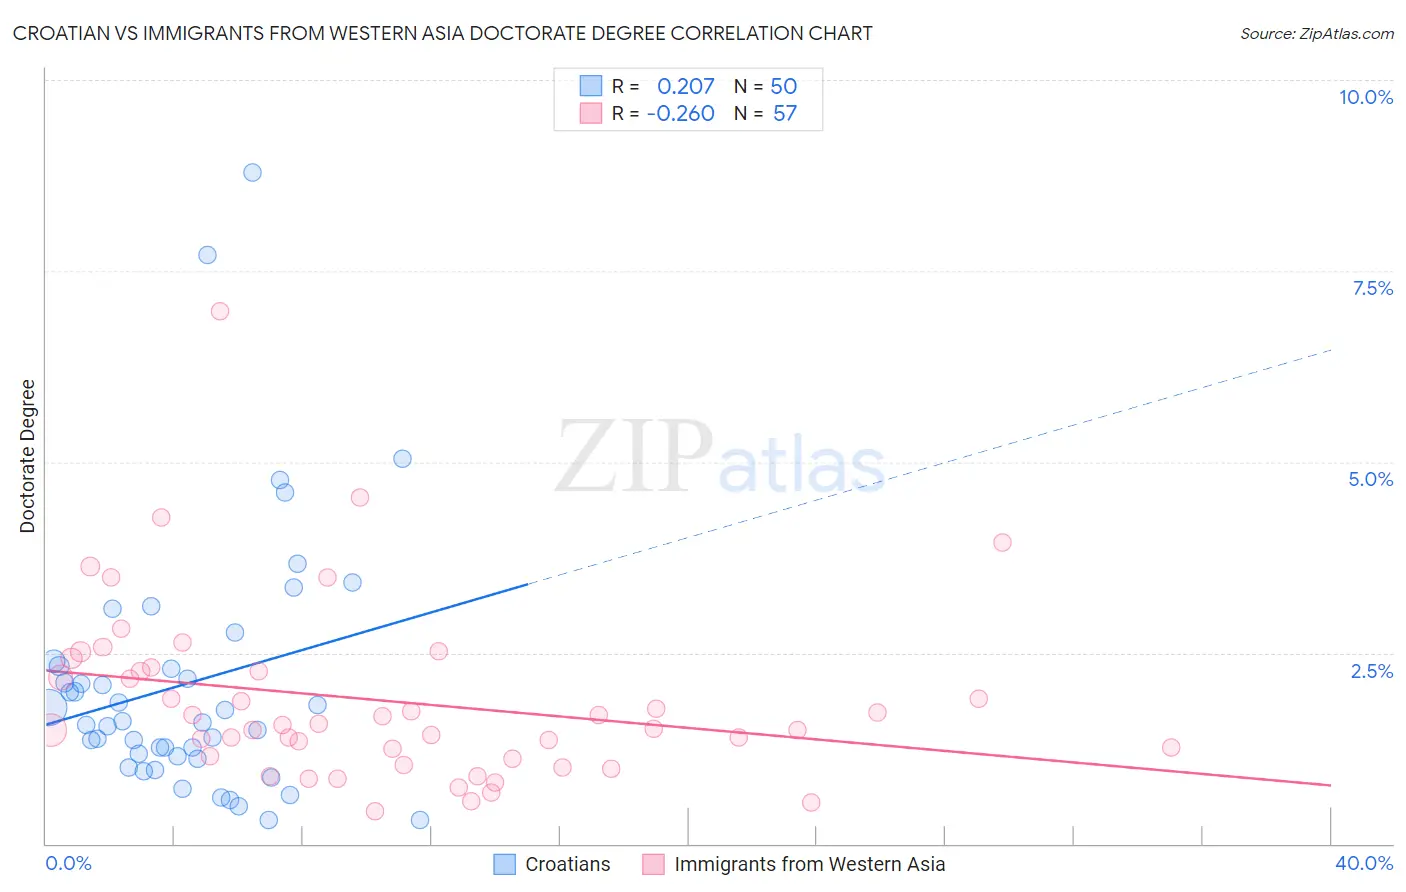
Croatian vs Immigrants from Western Asia Doctorate Degree Correlation Chart
The statistical analysis conducted on geographies consisting of 372,078,203 people shows a weak positive correlation between the proportion of Croatians and percentage of population with at least doctorate degree education in the United States with a correlation coefficient (R) of 0.207 and weighted average of 2.0%. Similarly, the statistical analysis conducted on geographies consisting of 401,633,885 people shows a weak negative correlation between the proportion of Immigrants from Western Asia and percentage of population with at least doctorate degree education in the United States with a correlation coefficient (R) of -0.260 and weighted average of 2.2%, a difference of 11.0%.
Doctorate Degree Correlation Summary
| Measurement | Croatian | Immigrants from Western Asia |
| Minimum | 0.31% | 0.43% |
| Maximum | 8.8% | 7.0% |
| Range | 8.5% | 6.5% |
| Mean | 2.1% | 1.9% |
| Median | 1.6% | 1.6% |
| Interquartile 25% (IQ1) | 1.1% | 1.1% |
| Interquartile 75% (IQ3) | 2.3% | 2.3% |
| Interquartile Range (IQR) | 1.2% | 1.2% |
| Standard Deviation (Sample) | 1.7% | 1.2% |
| Standard Deviation (Population) | 1.7% | 1.2% |
Similar Demographics by Doctorate Degree
Demographics Similar to Croatians by Doctorate Degree
In terms of doctorate degree, the demographic groups most similar to Croatians are Immigrants from Southern Europe (2.0%, a difference of 0.46%), Ute (2.0%, a difference of 0.47%), Immigrants from Jordan (2.0%, a difference of 0.48%), Moroccan (2.0%, a difference of 0.58%), and Immigrants from Morocco (2.0%, a difference of 0.96%).
| Demographics | Rating | Rank | Doctorate Degree |
| Maltese | 96.2 /100 | #116 | Exceptional 2.1% |
| Lebanese | 96.0 /100 | #117 | Exceptional 2.1% |
| Icelanders | 96.0 /100 | #118 | Exceptional 2.1% |
| Pakistanis | 95.8 /100 | #119 | Exceptional 2.0% |
| Immigrants | Morocco | 95.5 /100 | #120 | Exceptional 2.0% |
| Immigrants | Jordan | 94.8 /100 | #121 | Exceptional 2.0% |
| Immigrants | Southern Europe | 94.7 /100 | #122 | Exceptional 2.0% |
| Croatians | 94.0 /100 | #123 | Exceptional 2.0% |
| Ute | 93.2 /100 | #124 | Exceptional 2.0% |
| Moroccans | 93.0 /100 | #125 | Exceptional 2.0% |
| Jordanians | 92.1 /100 | #126 | Exceptional 2.0% |
| Palestinians | 92.0 /100 | #127 | Exceptional 2.0% |
| Immigrants | Zaire | 91.1 /100 | #128 | Exceptional 2.0% |
| Canadians | 90.6 /100 | #129 | Exceptional 2.0% |
| Immigrants | Ukraine | 90.5 /100 | #130 | Exceptional 2.0% |
Demographics Similar to Immigrants from Western Asia by Doctorate Degree
In terms of doctorate degree, the demographic groups most similar to Immigrants from Western Asia are Immigrants from Hungary (2.2%, a difference of 0.070%), Immigrants from Lebanon (2.2%, a difference of 0.080%), Immigrants from North America (2.2%, a difference of 0.10%), Immigrants from Bulgaria (2.3%, a difference of 0.24%), and Immigrants from Canada (2.3%, a difference of 0.32%).
| Demographics | Rating | Rank | Doctorate Degree |
| Immigrants | Kazakhstan | 99.8 /100 | #68 | Exceptional 2.3% |
| Carpatho Rusyns | 99.8 /100 | #69 | Exceptional 2.3% |
| Lithuanians | 99.8 /100 | #70 | Exceptional 2.3% |
| Immigrants | Bolivia | 99.8 /100 | #71 | Exceptional 2.3% |
| Immigrants | Canada | 99.8 /100 | #72 | Exceptional 2.3% |
| Immigrants | Bulgaria | 99.8 /100 | #73 | Exceptional 2.3% |
| Immigrants | North America | 99.8 /100 | #74 | Exceptional 2.2% |
| Immigrants | Western Asia | 99.8 /100 | #75 | Exceptional 2.2% |
| Immigrants | Hungary | 99.8 /100 | #76 | Exceptional 2.2% |
| Immigrants | Lebanon | 99.8 /100 | #77 | Exceptional 2.2% |
| Immigrants | Belarus | 99.7 /100 | #78 | Exceptional 2.2% |
| Northern Europeans | 99.7 /100 | #79 | Exceptional 2.2% |
| Ugandans | 99.7 /100 | #80 | Exceptional 2.2% |
| Immigrants | Argentina | 99.7 /100 | #81 | Exceptional 2.2% |
| Immigrants | Uganda | 99.6 /100 | #82 | Exceptional 2.2% |