Immigrants from Philippines vs Immigrants from Saudi Arabia 8th Grade
COMPARE
Immigrants from Philippines
Immigrants from Saudi Arabia
8th Grade
8th Grade Comparison
Immigrants from Philippines
Immigrants from Saudi Arabia
94.6%
8TH GRADE
0.1/ 100
METRIC RATING
284th/ 347
METRIC RANK
96.3%
8TH GRADE
98.0/ 100
METRIC RATING
103rd/ 347
METRIC RANK
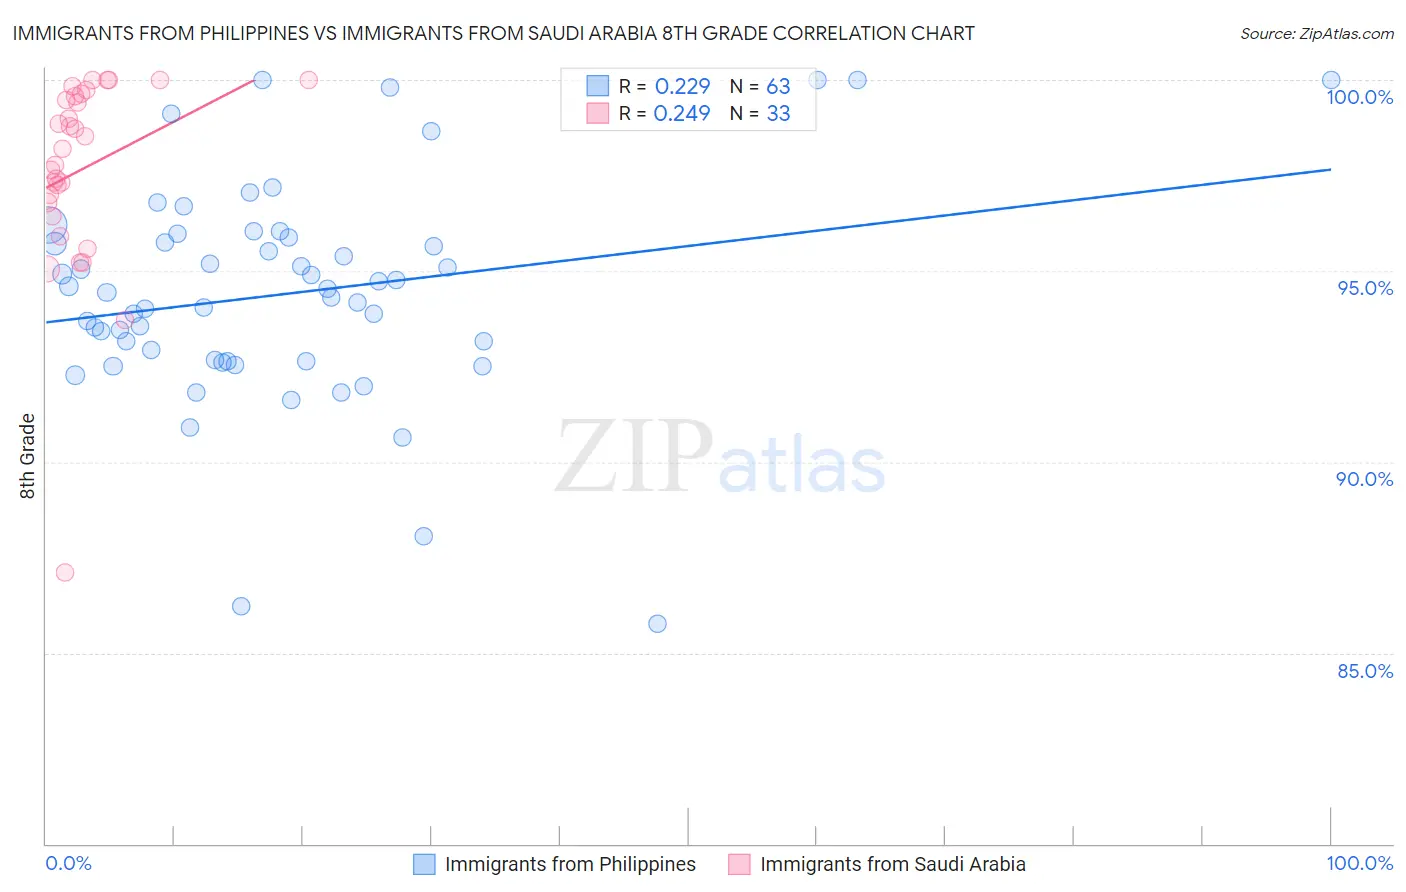
Immigrants from Philippines vs Immigrants from Saudi Arabia 8th Grade Correlation Chart
The statistical analysis conducted on geographies consisting of 471,300,535 people shows a weak positive correlation between the proportion of Immigrants from Philippines and percentage of population with at least 8th grade education in the United States with a correlation coefficient (R) of 0.229 and weighted average of 94.6%. Similarly, the statistical analysis conducted on geographies consisting of 164,277,573 people shows a weak positive correlation between the proportion of Immigrants from Saudi Arabia and percentage of population with at least 8th grade education in the United States with a correlation coefficient (R) of 0.249 and weighted average of 96.3%, a difference of 1.9%.
8th Grade Correlation Summary
| Measurement | Immigrants from Philippines | Immigrants from Saudi Arabia |
| Minimum | 85.8% | 87.1% |
| Maximum | 100.0% | 100.0% |
| Range | 14.2% | 12.9% |
| Mean | 94.4% | 97.7% |
| Median | 94.4% | 98.2% |
| Interquartile 25% (IQ1) | 92.6% | 96.6% |
| Interquartile 75% (IQ3) | 95.9% | 99.6% |
| Interquartile Range (IQR) | 3.3% | 3.0% |
| Standard Deviation (Sample) | 2.9% | 2.6% |
| Standard Deviation (Population) | 2.9% | 2.5% |
Similar Demographics by 8th Grade
Demographics Similar to Immigrants from Philippines by 8th Grade
In terms of 8th grade, the demographic groups most similar to Immigrants from Philippines are Immigrants from St. Vincent and the Grenadines (94.6%, a difference of 0.010%), Immigrants from Barbados (94.5%, a difference of 0.030%), Immigrants from Eritrea (94.6%, a difference of 0.040%), Immigrants from Bolivia (94.6%, a difference of 0.080%), and Immigrants from Peru (94.5%, a difference of 0.080%).
| Demographics | Rating | Rank | 8th Grade |
| Taiwanese | 0.1 /100 | #277 | Tragic 94.7% |
| Armenians | 0.1 /100 | #278 | Tragic 94.7% |
| Immigrants | Trinidad and Tobago | 0.1 /100 | #279 | Tragic 94.6% |
| Barbadians | 0.1 /100 | #280 | Tragic 94.6% |
| Immigrants | Bolivia | 0.1 /100 | #281 | Tragic 94.6% |
| Immigrants | Eritrea | 0.1 /100 | #282 | Tragic 94.6% |
| Immigrants | St. Vincent and the Grenadines | 0.1 /100 | #283 | Tragic 94.6% |
| Immigrants | Philippines | 0.1 /100 | #284 | Tragic 94.6% |
| Immigrants | Barbados | 0.0 /100 | #285 | Tragic 94.5% |
| Immigrants | Peru | 0.0 /100 | #286 | Tragic 94.5% |
| Tohono O'odham | 0.0 /100 | #287 | Tragic 94.5% |
| Malaysians | 0.0 /100 | #288 | Tragic 94.5% |
| British West Indians | 0.0 /100 | #289 | Tragic 94.4% |
| Immigrants | West Indies | 0.0 /100 | #290 | Tragic 94.3% |
| Immigrants | Grenada | 0.0 /100 | #291 | Tragic 94.3% |
Demographics Similar to Immigrants from Saudi Arabia by 8th Grade
In terms of 8th grade, the demographic groups most similar to Immigrants from Saudi Arabia are Kiowa (96.3%, a difference of 0.0%), Immigrants from North Macedonia (96.3%, a difference of 0.0%), Okinawan (96.3%, a difference of 0.0%), South African (96.4%, a difference of 0.010%), and Immigrants from Latvia (96.3%, a difference of 0.010%).
| Demographics | Rating | Rank | 8th Grade |
| Potawatomi | 98.7 /100 | #96 | Exceptional 96.4% |
| Osage | 98.7 /100 | #97 | Exceptional 96.4% |
| Immigrants | Germany | 98.7 /100 | #98 | Exceptional 96.4% |
| Cree | 98.6 /100 | #99 | Exceptional 96.4% |
| Immigrants | Czechoslovakia | 98.6 /100 | #100 | Exceptional 96.4% |
| Bhutanese | 98.2 /100 | #101 | Exceptional 96.4% |
| South Africans | 98.2 /100 | #102 | Exceptional 96.4% |
| Immigrants | Saudi Arabia | 98.0 /100 | #103 | Exceptional 96.3% |
| Kiowa | 98.0 /100 | #104 | Exceptional 96.3% |
| Immigrants | North Macedonia | 98.0 /100 | #105 | Exceptional 96.3% |
| Okinawans | 98.0 /100 | #106 | Exceptional 96.3% |
| Immigrants | Latvia | 97.8 /100 | #107 | Exceptional 96.3% |
| Lebanese | 97.5 /100 | #108 | Exceptional 96.3% |
| Iroquois | 97.5 /100 | #109 | Exceptional 96.3% |
| Cajuns | 97.1 /100 | #110 | Exceptional 96.3% |