Immigrants from Greece vs Immigrants from Saudi Arabia 8th Grade

COMPARE

Immigrants from Greece
Race
Ancestry
AfghanAfricanAlaska NativeAlaskan AthabascanAlbanianAleutAlsatianAmericanApacheArabArapahoArgentineanArmenianAssyrian/Chaldean/SyriacAustralianAustrianBahamianBangladeshiBarbadianBasqueBelgianBelizeanBermudanBhutaneseBlackfeetBolivianBrazilianBritishBritish West IndianBulgarianBurmeseCajunCambodianCanadianCape VerdeanCarpatho RusynCelticCentral AmericanCentral American IndianCherokeeCheyenneChickasawChileanChineseChippewaChoctawColombianColvilleComancheCosta RicanCreeCreekCroatianCrowCubanCypriotCzechCzechoslovakianDanishDelawareDominicanDutchDutch West IndianEastern EuropeanEcuadorianEgyptianEnglishEstonianEthiopianEuropeanFijianFilipinoFinnishFrenchFrench American IndianFrench CanadianGermanGerman RussianGhanaianGreekGuamanian/ChamorroGuatemalanGuyaneseHaitianHmongHonduranHopiHoumaHungarianIcelanderIndian (Asian)IndonesianInupiatIranianIraqiIrishIroquoisIsraeliItalianJamaicanJapaneseJordanianKenyanKiowaKoreanLaotianLatvianLebaneseLiberianLithuanianLumbeeLuxembourgerMacedonianMalaysianMalteseMarshalleseMenomineeMexicanMexican American IndianMongolianMoroccanNative HawaiianNavajoNepaleseNew ZealanderNicaraguanNigerianNorthern EuropeanNorwegianOkinawanOsageOttawaPaiutePakistaniPalestinianPanamanianParaguayanPennsylvania GermanPeruvianPimaPolishPortuguesePotawatomiPuebloPuerto RicanPuget Sound SalishRomanianRussianSalvadoranSamoanScandinavianScotch-IrishScottishSeminoleSenegaleseSerbianShoshoneSierra LeoneanSiouxSlavicSlovakSloveneSomaliSouth AfricanSouth AmericanSouth American IndianSoviet UnionSpaniardSpanishSpanish AmericanSpanish American IndianSri LankanSubsaharan AfricanSudaneseSwedishSwissSyrianTaiwaneseThaiTlingit-HaidaTohono O'OdhamTonganTrinidadian and TobagonianTsimshianTurkishU.S. Virgin IslanderUgandanUkrainianUruguayanUteVenezuelanVietnameseWelshWest IndianYakamaYaquiYugoslavianYumanYup'ikZimbabwean
Immigration
NonimmigrantsImmigrantsAfghanistanAfricaAlbaniaArgentinaArmeniaAsiaAustraliaAustriaBahamasBangladeshBarbadosBelarusBelgiumBelizeBoliviaBosnia and HerzegovinaBrazilBulgariaBurma/MyanmarCabo VerdeCambodiaCameroonCanadaCaribbeanCentral AmericaChileChinaColombiaCongoCosta RicaCroatiaCubaCzechoslovakiaDenmarkDominicaDominican RepublicEastern AfricaEastern AsiaEastern EuropeEcuadorEgyptEl SalvadorEnglandEritreaEthiopiaEuropeFijiFranceGermanyGhanaGreeceGrenadaGuatemalaGuyanaHaitiHondurasHong KongHungaryIndiaIndonesiaIranIraqIrelandIsraelItalyJamaicaJapanJordanKazakhstanKenyaKoreaKuwaitLaosLatin AmericaLatviaLebanonLiberiaLithuaniaMalaysiaMexicoMicronesiaMiddle AfricaMoldovaMoroccoNepalNetherlandsNicaraguaNigeriaNorth AmericaNorth MacedoniaNorthern AfricaNorthern EuropeNorwayOceaniaPakistanPanamaPeruPhilippinesPolandPortugalRomaniaRussiaScotlandSenegalSerbiaSierra LeoneSingaporeSomaliaSouth AfricaSouth AmericaSouth Central AsiaSouth Eastern AsiaSouthern EuropeSpainSri LankaSt. Vincent and the GrenadinesSudanSwedenSwitzerlandSyriaTaiwanThailandTrinidad and TobagoTurkeyUgandaUkraineUruguayUzbekistanVenezuelaVietnamWest IndiesWestern AfricaWestern AsiaWestern EuropeYemenZaireZimbabweAzores
Immigrants from Saudi Arabia
Race
Ancestry
AfghanAfricanAlaska NativeAlaskan AthabascanAlbanianAleutAlsatianAmericanApacheArabArapahoArgentineanArmenianAssyrian/Chaldean/SyriacAustralianAustrianBahamianBangladeshiBarbadianBasqueBelgianBelizeanBermudanBhutaneseBlackfeetBolivianBrazilianBritishBritish West IndianBulgarianBurmeseCajunCambodianCanadianCape VerdeanCarpatho RusynCelticCentral AmericanCentral American IndianCherokeeCheyenneChickasawChileanChineseChippewaChoctawColombianColvilleComancheCosta RicanCreeCreekCroatianCrowCubanCypriotCzechCzechoslovakianDanishDelawareDominicanDutchDutch West IndianEastern EuropeanEcuadorianEgyptianEnglishEstonianEthiopianEuropeanFijianFilipinoFinnishFrenchFrench American IndianFrench CanadianGermanGerman RussianGhanaianGreekGuamanian/ChamorroGuatemalanGuyaneseHaitianHmongHonduranHopiHoumaHungarianIcelanderIndian (Asian)IndonesianInupiatIranianIraqiIrishIroquoisIsraeliItalianJamaicanJapaneseJordanianKenyanKiowaKoreanLaotianLatvianLebaneseLiberianLithuanianLumbeeLuxembourgerMacedonianMalaysianMalteseMarshalleseMenomineeMexicanMexican American IndianMongolianMoroccanNative HawaiianNavajoNepaleseNew ZealanderNicaraguanNigerianNorthern EuropeanNorwegianOkinawanOsageOttawaPaiutePakistaniPalestinianPanamanianParaguayanPennsylvania GermanPeruvianPimaPolishPortuguesePotawatomiPuebloPuerto RicanPuget Sound SalishRomanianRussianSalvadoranSamoanScandinavianScotch-IrishScottishSeminoleSenegaleseSerbianShoshoneSierra LeoneanSiouxSlavicSlovakSloveneSomaliSouth AfricanSouth AmericanSouth American IndianSoviet UnionSpaniardSpanishSpanish AmericanSpanish American IndianSri LankanSubsaharan AfricanSudaneseSwedishSwissSyrianTaiwaneseThaiTlingit-HaidaTohono O'OdhamTonganTrinidadian and TobagonianTsimshianTurkishU.S. Virgin IslanderUgandanUkrainianUruguayanUteVenezuelanVietnameseWelshWest IndianYakamaYaquiYugoslavianYumanYup'ikZimbabwean
Immigration
NonimmigrantsImmigrantsAfghanistanAfricaAlbaniaArgentinaArmeniaAsiaAustraliaAustriaBahamasBangladeshBarbadosBelarusBelgiumBelizeBoliviaBosnia and HerzegovinaBrazilBulgariaBurma/MyanmarCabo VerdeCambodiaCameroonCanadaCaribbeanCentral AmericaChileChinaColombiaCongoCosta RicaCroatiaCubaCzechoslovakiaDenmarkDominicaDominican RepublicEastern AfricaEastern AsiaEastern EuropeEcuadorEgyptEl SalvadorEnglandEritreaEthiopiaEuropeFijiFranceGermanyGhanaGrenadaGuatemalaGuyanaHaitiHondurasHong KongHungaryIndiaIndonesiaIranIraqIrelandIsraelItalyJamaicaJapanJordanKazakhstanKenyaKoreaKuwaitLaosLatin AmericaLatviaLebanonLiberiaLithuaniaMalaysiaMexicoMicronesiaMiddle AfricaMoldovaMoroccoNepalNetherlandsNicaraguaNigeriaNorth AmericaNorth MacedoniaNorthern AfricaNorthern EuropeNorwayOceaniaPakistanPanamaPeruPhilippinesPolandPortugalRomaniaRussiaSaudi ArabiaScotlandSenegalSerbiaSierra LeoneSingaporeSomaliaSouth AfricaSouth AmericaSouth Central AsiaSouth Eastern AsiaSouthern EuropeSpainSri LankaSt. Vincent and the GrenadinesSudanSwedenSwitzerlandSyriaTaiwanThailandTrinidad and TobagoTurkeyUgandaUkraineUruguayUzbekistanVenezuelaVietnamWest IndiesWestern AfricaWestern AsiaWestern EuropeYemenZaireZimbabweAzores
8th Grade
Income
Poverty
Unemployment
Labor Participation
Family Structure
Vehicle Availability
Education Level
Disability

8th Grade Comparison

Immigrants from Greece

Immigrants from Saudi Arabia

Excellent
Exceptional
96.0%
8TH GRADE
85.9/ 100
METRIC RATING
141st/ 347
METRIC RANK
96.3%
8TH GRADE
98.0/ 100
METRIC RATING
103rd/ 347
METRIC RANK

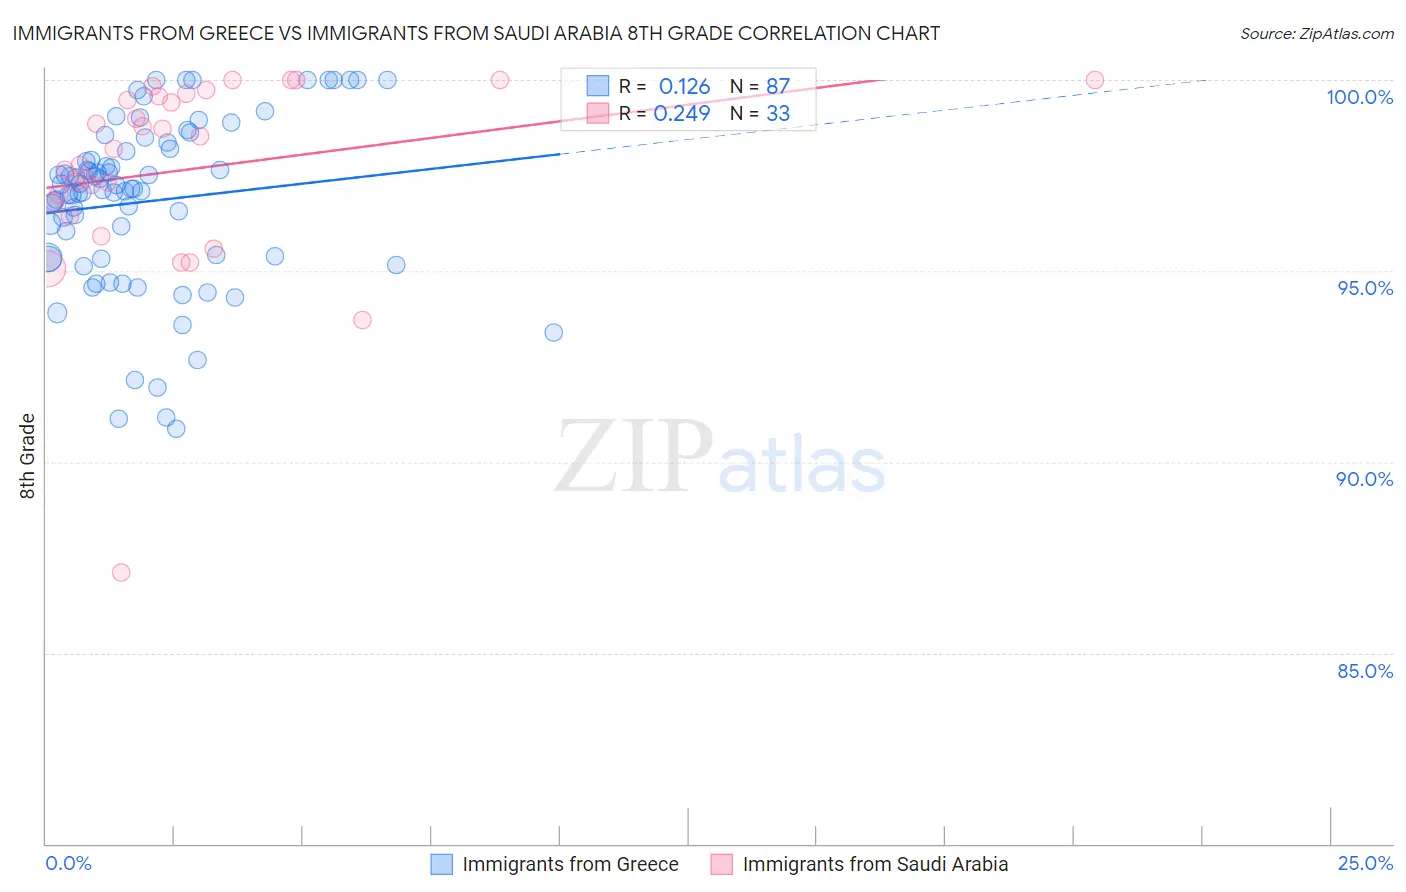
Immigrants from Greece vs Immigrants from Saudi Arabia 8th Grade Correlation Chart

The statistical analysis conducted on geographies consisting of 216,879,847 people shows a poor positive correlation between the proportion of Immigrants from Greece and percentage of population with at least 8th grade education in the United States with a correlation coefficient (R) of 0.126 and weighted average of 96.0%. Similarly, the statistical analysis conducted on geographies consisting of 164,277,573 people shows a weak positive correlation between the proportion of Immigrants from Saudi Arabia and percentage of population with at least 8th grade education in the United States with a correlation coefficient (R) of 0.249 and weighted average of 96.3%, a difference of 0.34%.
Immigrants from Greece vs Immigrants from Saudi Arabia 8th Grade

8th Grade Correlation Summary

MeasurementImmigrants from GreeceImmigrants from Saudi Arabia
Minimum90.9%87.1%
Maximum100.0%100.0%
Range9.1%12.9%
Mean96.8%97.7%
Median97.2%98.2%
Interquartile 25% (IQ1)95.4%96.6%
Interquartile 75% (IQ3)98.2%99.6%
Interquartile Range (IQR)2.8%3.0%
Standard Deviation (Sample)2.2%2.6%
Standard Deviation (Population)2.2%2.5%

Similar Demographics by 8th Grade

Demographics Similar to Immigrants from Greece by 8th Grade

In terms of 8th grade, the demographic groups most similar to Immigrants from Greece are Immigrants from Eastern Europe (96.0%, a difference of 0.010%), Spanish (96.0%, a difference of 0.010%), Immigrants from Belarus (96.0%, a difference of 0.010%), Lumbee (96.0%, a difference of 0.020%), and Israeli (96.0%, a difference of 0.020%).
DemographicsRating | Rank8th Grade
Immigrants | Hungary
91.5
/100
|
#134
Exceptional
96.1%
Basques
91.5
/100
|
#135
Exceptional
96.1%
Jordanians
91.3
/100
|
#136
Exceptional
96.1%
Cambodians
90.6
/100
|
#137
Exceptional
96.1%
Burmese
90.2
/100
|
#138
Exceptional
96.1%
Hmong
89.7
/100
|
#139
Excellent
96.1%
Immigrants | South Central Asia
89.4
/100
|
#140
Excellent
96.1%
Immigrants | Greece
85.9
/100
|
#141
Excellent
96.0%
Immigrants | Eastern Europe
85.4
/100
|
#142
Excellent
96.0%
Spanish
85.1
/100
|
#143
Excellent
96.0%
Immigrants | Belarus
84.8
/100
|
#144
Excellent
96.0%
Lumbee
84.1
/100
|
#145
Excellent
96.0%
Israelis
84.1
/100
|
#146
Excellent
96.0%
Colville
84.0
/100
|
#147
Excellent
96.0%
Albanians
83.1
/100
|
#148
Excellent
96.0%

Demographics Similar to Immigrants from Saudi Arabia by 8th Grade

In terms of 8th grade, the demographic groups most similar to Immigrants from Saudi Arabia are Kiowa (96.3%, a difference of 0.0%), Immigrants from North Macedonia (96.3%, a difference of 0.0%), Okinawan (96.3%, a difference of 0.0%), South African (96.4%, a difference of 0.010%), and Immigrants from Latvia (96.3%, a difference of 0.010%).
DemographicsRating | Rank8th Grade
Potawatomi
98.7
/100
|
#96
Exceptional
96.4%
Osage
98.7
/100
|
#97
Exceptional
96.4%
Immigrants | Germany
98.7
/100
|
#98
Exceptional
96.4%
Cree
98.6
/100
|
#99
Exceptional
96.4%
Immigrants | Czechoslovakia
98.6
/100
|
#100
Exceptional
96.4%
Bhutanese
98.2
/100
|
#101
Exceptional
96.4%
South Africans
98.2
/100
|
#102
Exceptional
96.4%
Immigrants | Saudi Arabia
98.0
/100
|
#103
Exceptional
96.3%
Kiowa
98.0
/100
|
#104
Exceptional
96.3%
Immigrants | North Macedonia
98.0
/100
|
#105
Exceptional
96.3%
Okinawans
98.0
/100
|
#106
Exceptional
96.3%
Immigrants | Latvia
97.8
/100
|
#107
Exceptional
96.3%
Lebanese
97.5
/100
|
#108
Exceptional
96.3%
Iroquois
97.5
/100
|
#109
Exceptional
96.3%
Cajuns
97.1
/100
|
#110
Exceptional
96.3%