Immigrants from Peru vs Immigrants from South America 12th Grade, No Diploma
COMPARE
Immigrants from Peru
Immigrants from South America
12th Grade, No Diploma
12th Grade, No Diploma Comparison
Immigrants from Peru
Immigrants from South America
89.7%
12TH GRADE, NO DIPLOMA
0.5/ 100
METRIC RATING
254th/ 347
METRIC RANK
90.1%
12TH GRADE, NO DIPLOMA
2.3/ 100
METRIC RATING
234th/ 347
METRIC RANK
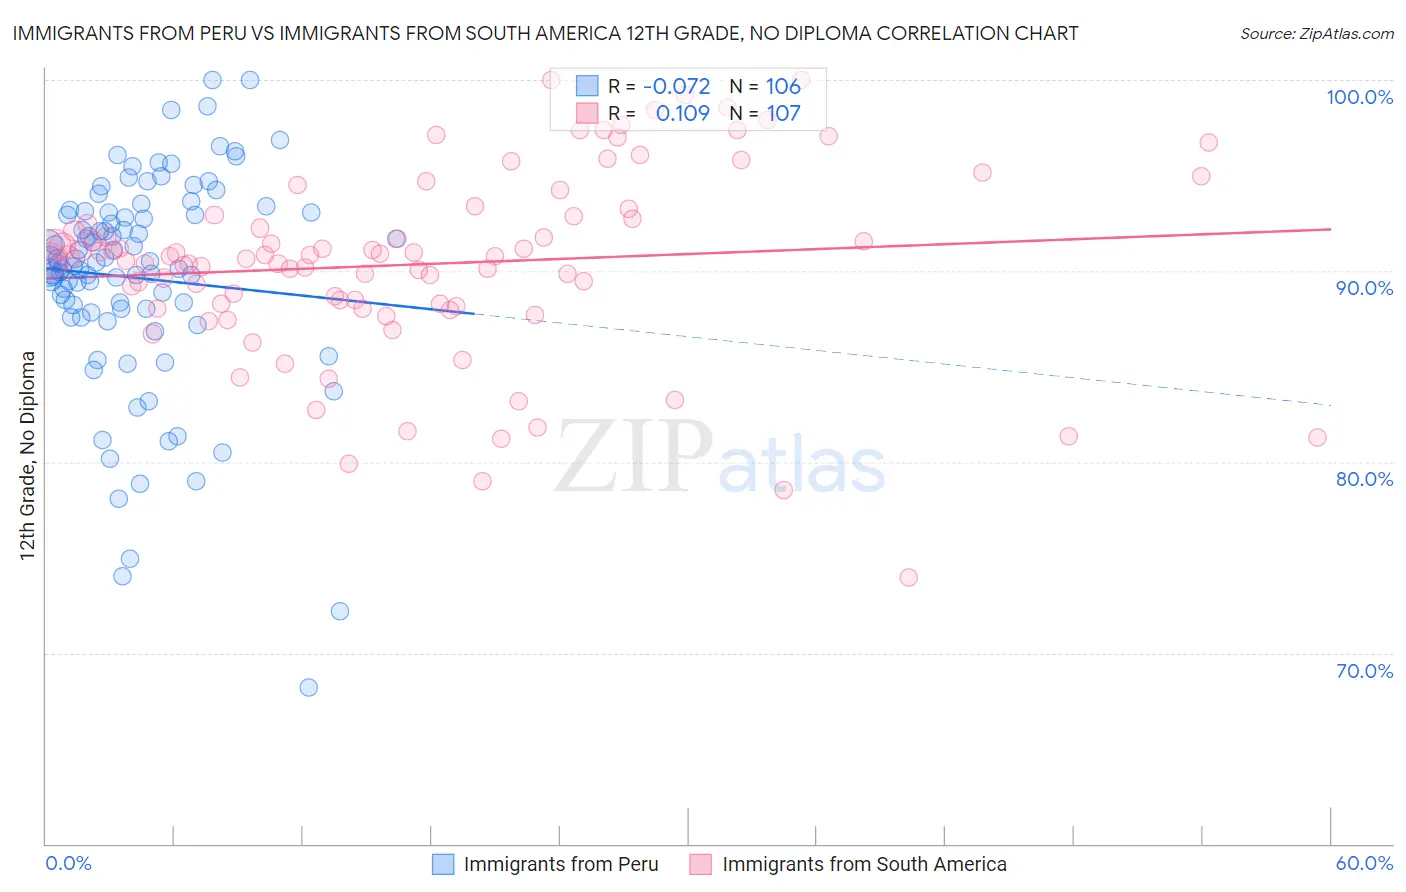
Immigrants from Peru vs Immigrants from South America 12th Grade, No Diploma Correlation Chart
The statistical analysis conducted on geographies consisting of 328,860,880 people shows a slight negative correlation between the proportion of Immigrants from Peru and percentage of population with at least 12th grade (no diploma) education in the United States with a correlation coefficient (R) of -0.072 and weighted average of 89.7%. Similarly, the statistical analysis conducted on geographies consisting of 486,312,594 people shows a poor positive correlation between the proportion of Immigrants from South America and percentage of population with at least 12th grade (no diploma) education in the United States with a correlation coefficient (R) of 0.109 and weighted average of 90.1%, a difference of 0.46%.
12th Grade, No Diploma Correlation Summary
| Measurement | Immigrants from Peru | Immigrants from South America |
| Minimum | 68.2% | 73.9% |
| Maximum | 100.0% | 100.0% |
| Range | 31.8% | 26.1% |
| Mean | 89.6% | 90.4% |
| Median | 90.4% | 90.7% |
| Interquartile 25% (IQ1) | 88.0% | 88.1% |
| Interquartile 75% (IQ3) | 93.1% | 92.9% |
| Interquartile Range (IQR) | 5.0% | 4.8% |
| Standard Deviation (Sample) | 5.7% | 4.9% |
| Standard Deviation (Population) | 5.6% | 4.9% |
Demographics Similar to Immigrants from Peru and Immigrants from South America by 12th Grade, No Diploma
In terms of 12th grade, no diploma, the demographic groups most similar to Immigrants from Peru are Choctaw (89.8%, a difference of 0.090%), Bahamian (89.9%, a difference of 0.17%), Spanish American (89.9%, a difference of 0.18%), Immigrants from Eritrea (89.9%, a difference of 0.19%), and Comanche (89.9%, a difference of 0.22%). Similarly, the demographic groups most similar to Immigrants from South America are Colville (90.1%, a difference of 0.0%), Immigrants from Uzbekistan (90.1%, a difference of 0.0%), Immigrants from Colombia (90.1%, a difference of 0.030%), Inupiat (90.1%, a difference of 0.040%), and Subsaharan African (90.1%, a difference of 0.060%).
| Demographics | Rating | Rank | 12th Grade, No Diploma |
| Immigrants | South America | 2.3 /100 | #234 | Tragic 90.1% |
| Colville | 2.3 /100 | #235 | Tragic 90.1% |
| Immigrants | Uzbekistan | 2.2 /100 | #236 | Tragic 90.1% |
| Immigrants | Colombia | 2.1 /100 | #237 | Tragic 90.1% |
| Inupiat | 2.0 /100 | #238 | Tragic 90.1% |
| Sub-Saharan Africans | 1.9 /100 | #239 | Tragic 90.1% |
| Kiowa | 1.7 /100 | #240 | Tragic 90.0% |
| Immigrants | Middle Africa | 1.7 /100 | #241 | Tragic 90.0% |
| Immigrants | Costa Rica | 1.6 /100 | #242 | Tragic 90.0% |
| Crow | 1.5 /100 | #243 | Tragic 90.0% |
| Taiwanese | 1.5 /100 | #244 | Tragic 90.0% |
| Immigrants | Uruguay | 1.4 /100 | #245 | Tragic 90.0% |
| Ghanaians | 1.3 /100 | #246 | Tragic 90.0% |
| Immigrants | Nigeria | 1.3 /100 | #247 | Tragic 89.9% |
| Comanche | 1.1 /100 | #248 | Tragic 89.9% |
| Senegalese | 1.1 /100 | #249 | Tragic 89.9% |
| Immigrants | Eritrea | 1.0 /100 | #250 | Tragic 89.9% |
| Spanish Americans | 0.9 /100 | #251 | Tragic 89.9% |
| Bahamians | 0.9 /100 | #252 | Tragic 89.9% |
| Choctaw | 0.7 /100 | #253 | Tragic 89.8% |
| Immigrants | Peru | 0.5 /100 | #254 | Tragic 89.7% |