Immigrants from Peru vs Bolivian 12th Grade, No Diploma
COMPARE
Immigrants from Peru
Bolivian
12th Grade, No Diploma
12th Grade, No Diploma Comparison
Immigrants from Peru
Bolivians
89.7%
12TH GRADE, NO DIPLOMA
0.5/ 100
METRIC RATING
254th/ 347
METRIC RANK
91.2%
12TH GRADE, NO DIPLOMA
50.4/ 100
METRIC RATING
173rd/ 347
METRIC RANK
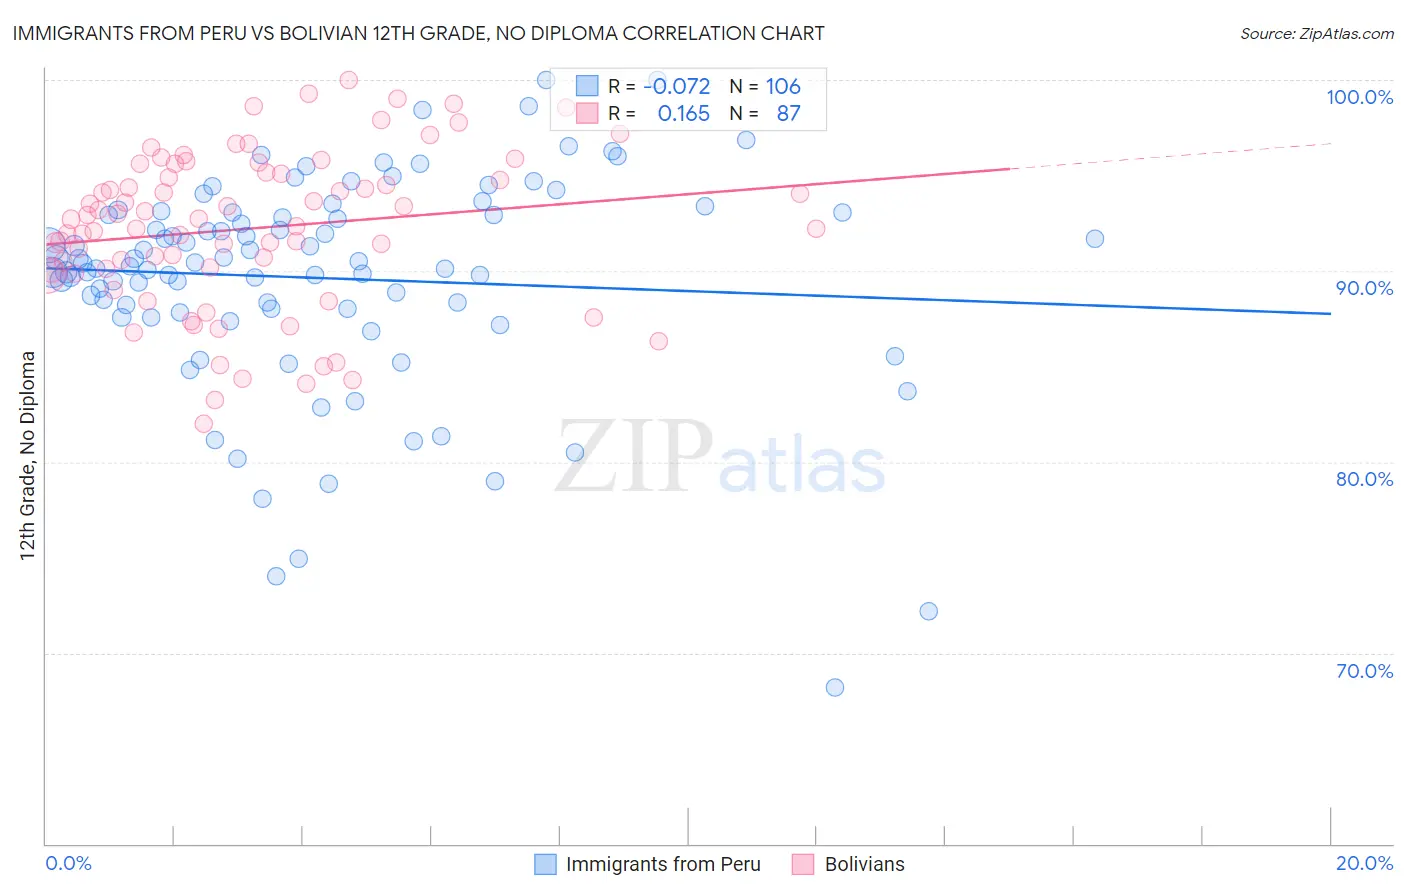
Immigrants from Peru vs Bolivian 12th Grade, No Diploma Correlation Chart
The statistical analysis conducted on geographies consisting of 328,860,880 people shows a slight negative correlation between the proportion of Immigrants from Peru and percentage of population with at least 12th grade (no diploma) education in the United States with a correlation coefficient (R) of -0.072 and weighted average of 89.7%. Similarly, the statistical analysis conducted on geographies consisting of 184,666,822 people shows a poor positive correlation between the proportion of Bolivians and percentage of population with at least 12th grade (no diploma) education in the United States with a correlation coefficient (R) of 0.165 and weighted average of 91.2%, a difference of 1.6%.
12th Grade, No Diploma Correlation Summary
| Measurement | Immigrants from Peru | Bolivian |
| Minimum | 68.2% | 82.0% |
| Maximum | 100.0% | 100.0% |
| Range | 31.8% | 18.0% |
| Mean | 89.6% | 92.2% |
| Median | 90.4% | 92.7% |
| Interquartile 25% (IQ1) | 88.0% | 90.0% |
| Interquartile 75% (IQ3) | 93.1% | 95.1% |
| Interquartile Range (IQR) | 5.0% | 5.1% |
| Standard Deviation (Sample) | 5.7% | 4.1% |
| Standard Deviation (Population) | 5.6% | 4.1% |
Similar Demographics by 12th Grade, No Diploma
Demographics Similar to Immigrants from Peru by 12th Grade, No Diploma
In terms of 12th grade, no diploma, the demographic groups most similar to Immigrants from Peru are Immigrants from Senegal (89.7%, a difference of 0.010%), Immigrants from Ghana (89.7%, a difference of 0.020%), Jamaican (89.7%, a difference of 0.020%), African (89.6%, a difference of 0.070%), and Choctaw (89.8%, a difference of 0.090%).
| Demographics | Rating | Rank | 12th Grade, No Diploma |
| Immigrants | Nigeria | 1.3 /100 | #247 | Tragic 89.9% |
| Comanche | 1.1 /100 | #248 | Tragic 89.9% |
| Senegalese | 1.1 /100 | #249 | Tragic 89.9% |
| Immigrants | Eritrea | 1.0 /100 | #250 | Tragic 89.9% |
| Spanish Americans | 0.9 /100 | #251 | Tragic 89.9% |
| Bahamians | 0.9 /100 | #252 | Tragic 89.9% |
| Choctaw | 0.7 /100 | #253 | Tragic 89.8% |
| Immigrants | Peru | 0.5 /100 | #254 | Tragic 89.7% |
| Immigrants | Senegal | 0.5 /100 | #255 | Tragic 89.7% |
| Immigrants | Ghana | 0.5 /100 | #256 | Tragic 89.7% |
| Jamaicans | 0.5 /100 | #257 | Tragic 89.7% |
| Africans | 0.4 /100 | #258 | Tragic 89.6% |
| Immigrants | Western Africa | 0.4 /100 | #259 | Tragic 89.6% |
| Immigrants | South Eastern Asia | 0.4 /100 | #260 | Tragic 89.6% |
| Cheyenne | 0.4 /100 | #261 | Tragic 89.6% |
Demographics Similar to Bolivians by 12th Grade, No Diploma
In terms of 12th grade, no diploma, the demographic groups most similar to Bolivians are Immigrants from Nepal (91.2%, a difference of 0.0%), Immigrants from Morocco (91.2%, a difference of 0.010%), Bermudan (91.2%, a difference of 0.010%), Immigrants from Western Asia (91.2%, a difference of 0.020%), and Iroquois (91.1%, a difference of 0.020%).
| Demographics | Rating | Rank | 12th Grade, No Diploma |
| Hmong | 58.0 /100 | #166 | Average 91.3% |
| Immigrants | Malaysia | 57.8 /100 | #167 | Average 91.3% |
| Cree | 57.0 /100 | #168 | Average 91.2% |
| Immigrants | Indonesia | 54.9 /100 | #169 | Average 91.2% |
| Delaware | 52.8 /100 | #170 | Average 91.2% |
| Immigrants | Morocco | 51.4 /100 | #171 | Average 91.2% |
| Bermudans | 50.8 /100 | #172 | Average 91.2% |
| Bolivians | 50.4 /100 | #173 | Average 91.2% |
| Immigrants | Nepal | 50.0 /100 | #174 | Average 91.2% |
| Immigrants | Western Asia | 49.0 /100 | #175 | Average 91.2% |
| Iroquois | 48.5 /100 | #176 | Average 91.1% |
| Sierra Leoneans | 47.7 /100 | #177 | Average 91.1% |
| Spanish | 43.7 /100 | #178 | Average 91.1% |
| Immigrants | Chile | 43.3 /100 | #179 | Average 91.1% |
| Immigrants | Syria | 40.3 /100 | #180 | Average 91.1% |