Immigrants from Pakistan vs Pennsylvania German Kindergarten
COMPARE
Immigrants from Pakistan
Pennsylvania German
Kindergarten
Kindergarten Comparison
Immigrants from Pakistan
Pennsylvania Germans
97.7%
KINDERGARTEN
2.2/ 100
METRIC RATING
233rd/ 347
METRIC RANK
98.6%
KINDERGARTEN
100.0/ 100
METRIC RATING
20th/ 347
METRIC RANK
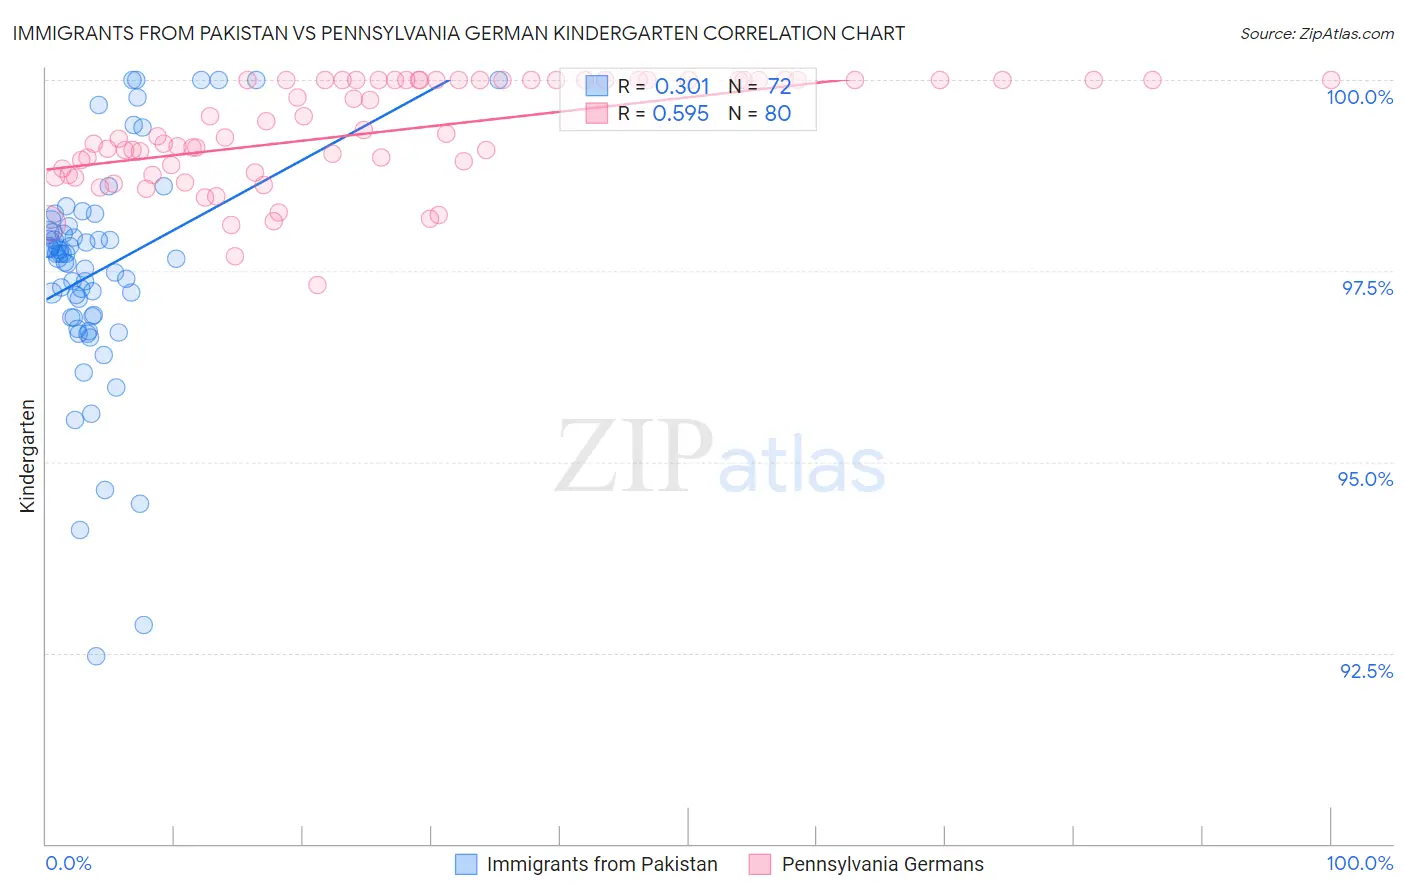
Immigrants from Pakistan vs Pennsylvania German Kindergarten Correlation Chart
The statistical analysis conducted on geographies consisting of 283,901,001 people shows a mild positive correlation between the proportion of Immigrants from Pakistan and percentage of population with at least kindergarten education in the United States with a correlation coefficient (R) of 0.301 and weighted average of 97.7%. Similarly, the statistical analysis conducted on geographies consisting of 234,102,531 people shows a substantial positive correlation between the proportion of Pennsylvania Germans and percentage of population with at least kindergarten education in the United States with a correlation coefficient (R) of 0.595 and weighted average of 98.6%, a difference of 0.96%.
Kindergarten Correlation Summary
| Measurement | Immigrants from Pakistan | Pennsylvania German |
| Minimum | 92.5% | 97.3% |
| Maximum | 100.0% | 100.0% |
| Range | 7.5% | 2.7% |
| Mean | 97.5% | 99.3% |
| Median | 97.7% | 99.3% |
| Interquartile 25% (IQ1) | 96.9% | 98.8% |
| Interquartile 75% (IQ3) | 98.0% | 100.0% |
| Interquartile Range (IQR) | 1.1% | 1.2% |
| Standard Deviation (Sample) | 1.5% | 0.68% |
| Standard Deviation (Population) | 1.5% | 0.68% |
Similar Demographics by Kindergarten
Demographics Similar to Immigrants from Pakistan by Kindergarten
In terms of kindergarten, the demographic groups most similar to Immigrants from Pakistan are Immigrants from Malaysia (97.7%, a difference of 0.0%), Colombian (97.7%, a difference of 0.0%), Immigrants from Western Asia (97.7%, a difference of 0.0%), Immigrants from Uruguay (97.7%, a difference of 0.010%), and Puerto Rican (97.7%, a difference of 0.020%).
| Demographics | Rating | Rank | Kindergarten |
| Sudanese | 3.7 /100 | #226 | Tragic 97.7% |
| Immigrants | Costa Rica | 3.6 /100 | #227 | Tragic 97.7% |
| Sub-Saharan Africans | 3.5 /100 | #228 | Tragic 97.7% |
| Sierra Leoneans | 3.4 /100 | #229 | Tragic 97.7% |
| Senegalese | 3.3 /100 | #230 | Tragic 97.7% |
| Puerto Ricans | 2.7 /100 | #231 | Tragic 97.7% |
| Immigrants | Uruguay | 2.6 /100 | #232 | Tragic 97.7% |
| Immigrants | Pakistan | 2.2 /100 | #233 | Tragic 97.7% |
| Immigrants | Malaysia | 2.2 /100 | #234 | Tragic 97.7% |
| Colombians | 2.2 /100 | #235 | Tragic 97.7% |
| Immigrants | Western Asia | 2.1 /100 | #236 | Tragic 97.7% |
| Nigerians | 1.8 /100 | #237 | Tragic 97.6% |
| Immigrants | Eastern Asia | 1.7 /100 | #238 | Tragic 97.6% |
| U.S. Virgin Islanders | 1.7 /100 | #239 | Tragic 97.6% |
| Koreans | 1.6 /100 | #240 | Tragic 97.6% |
Demographics Similar to Pennsylvania Germans by Kindergarten
In terms of kindergarten, the demographic groups most similar to Pennsylvania Germans are Lithuanian (98.6%, a difference of 0.0%), Finnish (98.6%, a difference of 0.0%), Arapaho (98.6%, a difference of 0.0%), Danish (98.6%, a difference of 0.0%), and Sioux (98.6%, a difference of 0.0%).
| Demographics | Rating | Rank | Kindergarten |
| Carpatho Rusyns | 100.0 /100 | #13 | Exceptional 98.7% |
| English | 100.0 /100 | #14 | Exceptional 98.7% |
| Swedes | 100.0 /100 | #15 | Exceptional 98.7% |
| Aleuts | 100.0 /100 | #16 | Exceptional 98.6% |
| Scottish | 100.0 /100 | #17 | Exceptional 98.6% |
| Dutch | 100.0 /100 | #18 | Exceptional 98.6% |
| Irish | 100.0 /100 | #19 | Exceptional 98.6% |
| Pennsylvania Germans | 100.0 /100 | #20 | Exceptional 98.6% |
| Lithuanians | 100.0 /100 | #21 | Exceptional 98.6% |
| Finns | 100.0 /100 | #22 | Exceptional 98.6% |
| Arapaho | 100.0 /100 | #23 | Exceptional 98.6% |
| Danes | 100.0 /100 | #24 | Exceptional 98.6% |
| Sioux | 100.0 /100 | #25 | Exceptional 98.6% |
| Poles | 100.0 /100 | #26 | Exceptional 98.6% |
| Scotch-Irish | 100.0 /100 | #27 | Exceptional 98.6% |