Immigrants from Pakistan vs Immigrants from Middle Africa Kindergarten
COMPARE
Immigrants from Pakistan
Immigrants from Middle Africa
Kindergarten
Kindergarten Comparison
Immigrants from Pakistan
Immigrants from Middle Africa
97.7%
KINDERGARTEN
2.2/ 100
METRIC RATING
233rd/ 347
METRIC RANK
97.6%
KINDERGARTEN
1.0/ 100
METRIC RATING
248th/ 347
METRIC RANK
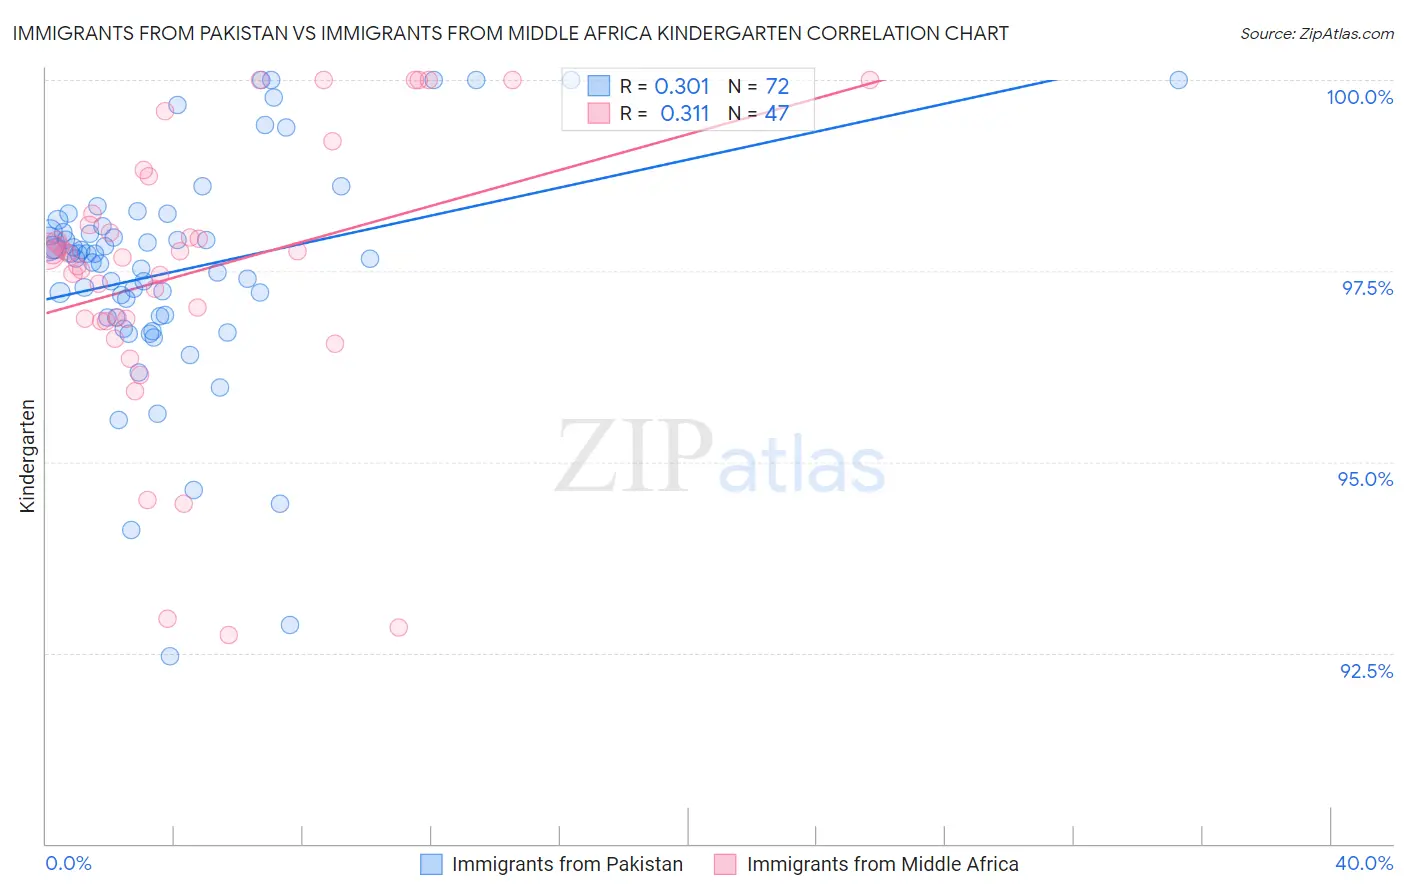
Immigrants from Pakistan vs Immigrants from Middle Africa Kindergarten Correlation Chart
The statistical analysis conducted on geographies consisting of 283,901,001 people shows a mild positive correlation between the proportion of Immigrants from Pakistan and percentage of population with at least kindergarten education in the United States with a correlation coefficient (R) of 0.301 and weighted average of 97.7%. Similarly, the statistical analysis conducted on geographies consisting of 202,721,852 people shows a mild positive correlation between the proportion of Immigrants from Middle Africa and percentage of population with at least kindergarten education in the United States with a correlation coefficient (R) of 0.311 and weighted average of 97.6%, a difference of 0.060%.
Kindergarten Correlation Summary
| Measurement | Immigrants from Pakistan | Immigrants from Middle Africa |
| Minimum | 92.5% | 92.7% |
| Maximum | 100.0% | 100.0% |
| Range | 7.5% | 7.3% |
| Mean | 97.5% | 97.5% |
| Median | 97.7% | 97.7% |
| Interquartile 25% (IQ1) | 96.9% | 96.8% |
| Interquartile 75% (IQ3) | 98.0% | 98.2% |
| Interquartile Range (IQR) | 1.1% | 1.4% |
| Standard Deviation (Sample) | 1.5% | 1.8% |
| Standard Deviation (Population) | 1.5% | 1.8% |
Demographics Similar to Immigrants from Pakistan and Immigrants from Middle Africa by Kindergarten
In terms of kindergarten, the demographic groups most similar to Immigrants from Pakistan are Immigrants from Malaysia (97.7%, a difference of 0.0%), Colombian (97.7%, a difference of 0.0%), Immigrants from Western Asia (97.7%, a difference of 0.0%), Immigrants from Uruguay (97.7%, a difference of 0.010%), and Puerto Rican (97.7%, a difference of 0.020%). Similarly, the demographic groups most similar to Immigrants from Middle Africa are South American (97.6%, a difference of 0.0%), Indian (Asian) (97.6%, a difference of 0.0%), Immigrants from Eastern Africa (97.6%, a difference of 0.0%), Peruvian (97.6%, a difference of 0.0%), and Asian (97.6%, a difference of 0.010%).
| Demographics | Rating | Rank | Kindergarten |
| Senegalese | 3.3 /100 | #230 | Tragic 97.7% |
| Puerto Ricans | 2.7 /100 | #231 | Tragic 97.7% |
| Immigrants | Uruguay | 2.6 /100 | #232 | Tragic 97.7% |
| Immigrants | Pakistan | 2.2 /100 | #233 | Tragic 97.7% |
| Immigrants | Malaysia | 2.2 /100 | #234 | Tragic 97.7% |
| Colombians | 2.2 /100 | #235 | Tragic 97.7% |
| Immigrants | Western Asia | 2.1 /100 | #236 | Tragic 97.7% |
| Nigerians | 1.8 /100 | #237 | Tragic 97.6% |
| Immigrants | Eastern Asia | 1.7 /100 | #238 | Tragic 97.6% |
| U.S. Virgin Islanders | 1.7 /100 | #239 | Tragic 97.6% |
| Koreans | 1.6 /100 | #240 | Tragic 97.6% |
| Liberians | 1.3 /100 | #241 | Tragic 97.6% |
| Immigrants | Indonesia | 1.3 /100 | #242 | Tragic 97.6% |
| Asians | 1.2 /100 | #243 | Tragic 97.6% |
| Bolivians | 1.2 /100 | #244 | Tragic 97.6% |
| South Americans | 1.1 /100 | #245 | Tragic 97.6% |
| Indians (Asian) | 1.0 /100 | #246 | Tragic 97.6% |
| Immigrants | Eastern Africa | 1.0 /100 | #247 | Tragic 97.6% |
| Immigrants | Middle Africa | 1.0 /100 | #248 | Tragic 97.6% |
| Peruvians | 1.0 /100 | #249 | Tragic 97.6% |
| Immigrants | Senegal | 0.9 /100 | #250 | Tragic 97.6% |