Immigrants from Norway vs Nepalese 6th Grade
COMPARE
Immigrants from Norway
Nepalese
6th Grade
6th Grade Comparison
Immigrants from Norway
Nepalese
97.4%
6TH GRADE
94.7/ 100
METRIC RATING
121st/ 347
METRIC RANK
94.9%
6TH GRADE
0.0/ 100
METRIC RATING
330th/ 347
METRIC RANK
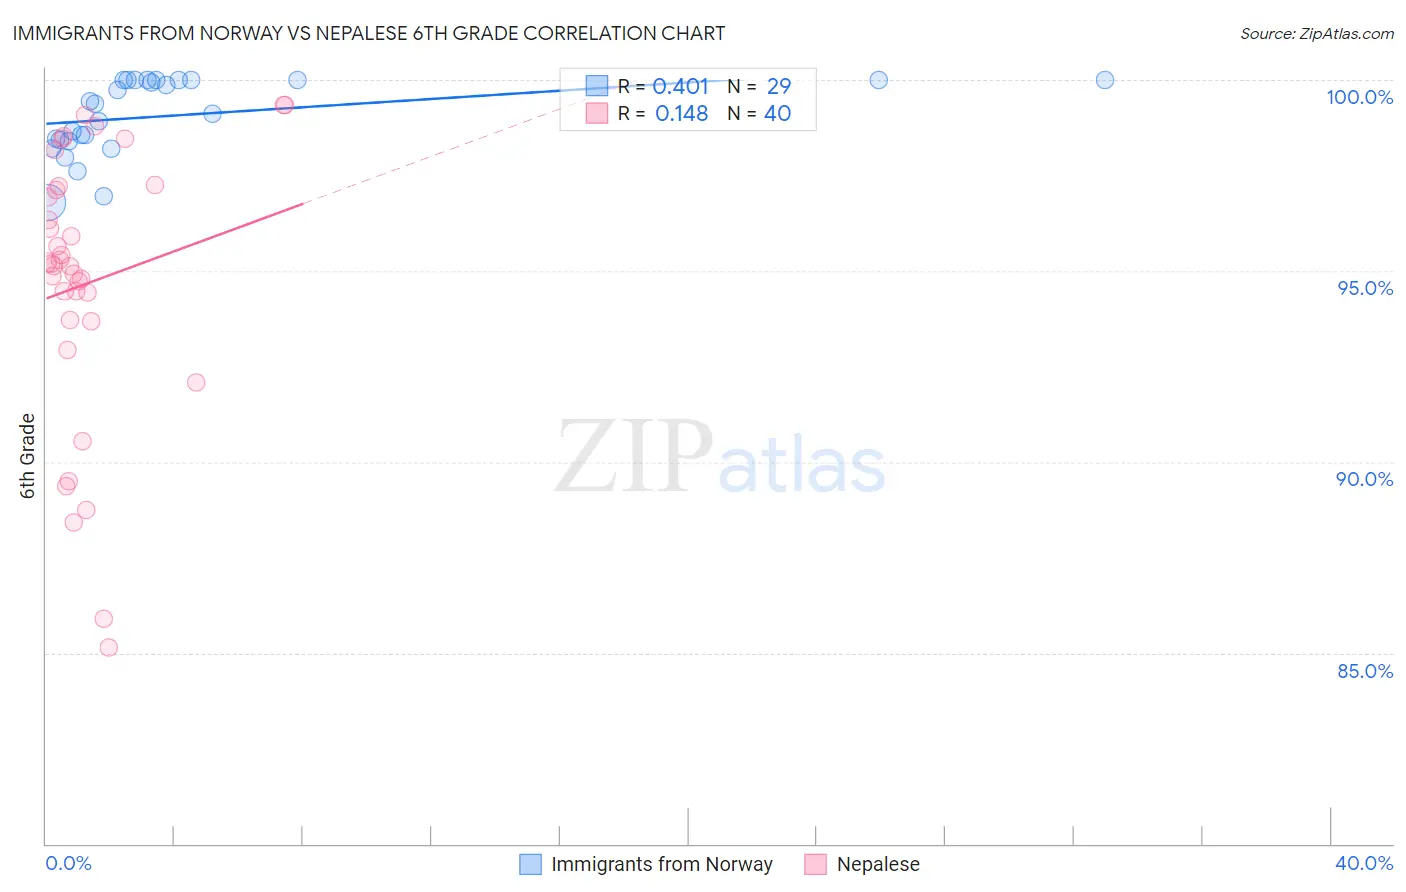
Immigrants from Norway vs Nepalese 6th Grade Correlation Chart
The statistical analysis conducted on geographies consisting of 116,716,420 people shows a moderate positive correlation between the proportion of Immigrants from Norway and percentage of population with at least 6th grade education in the United States with a correlation coefficient (R) of 0.401 and weighted average of 97.4%. Similarly, the statistical analysis conducted on geographies consisting of 24,521,755 people shows a poor positive correlation between the proportion of Nepalese and percentage of population with at least 6th grade education in the United States with a correlation coefficient (R) of 0.148 and weighted average of 94.9%, a difference of 2.6%.
6th Grade Correlation Summary
| Measurement | Immigrants from Norway | Nepalese |
| Minimum | 96.8% | 85.1% |
| Maximum | 100.0% | 99.3% |
| Range | 3.2% | 14.2% |
| Mean | 99.1% | 94.7% |
| Median | 99.4% | 95.2% |
| Interquartile 25% (IQ1) | 98.4% | 93.7% |
| Interquartile 75% (IQ3) | 100.0% | 97.2% |
| Interquartile Range (IQR) | 1.6% | 3.5% |
| Standard Deviation (Sample) | 0.98% | 3.6% |
| Standard Deviation (Population) | 0.97% | 3.5% |
Similar Demographics by 6th Grade
Demographics Similar to Immigrants from Norway by 6th Grade
In terms of 6th grade, the demographic groups most similar to Immigrants from Norway are Syrian (97.4%, a difference of 0.0%), Immigrants from France (97.4%, a difference of 0.0%), Immigrants from Japan (97.4%, a difference of 0.010%), Immigrants from Zimbabwe (97.4%, a difference of 0.010%), and Hmong (97.4%, a difference of 0.010%).
| Demographics | Rating | Rank | 6th Grade |
| Colville | 96.4 /100 | #114 | Exceptional 97.4% |
| Immigrants | Switzerland | 95.7 /100 | #115 | Exceptional 97.4% |
| Lebanese | 95.5 /100 | #116 | Exceptional 97.4% |
| Basques | 95.4 /100 | #117 | Exceptional 97.4% |
| Immigrants | Japan | 95.2 /100 | #118 | Exceptional 97.4% |
| Immigrants | Zimbabwe | 95.0 /100 | #119 | Exceptional 97.4% |
| Syrians | 94.8 /100 | #120 | Exceptional 97.4% |
| Immigrants | Norway | 94.7 /100 | #121 | Exceptional 97.4% |
| Immigrants | France | 94.5 /100 | #122 | Exceptional 97.4% |
| Hmong | 94.4 /100 | #123 | Exceptional 97.4% |
| Okinawans | 94.2 /100 | #124 | Exceptional 97.4% |
| Spanish | 93.7 /100 | #125 | Exceptional 97.3% |
| Immigrants | Bulgaria | 93.6 /100 | #126 | Exceptional 97.3% |
| Immigrants | Croatia | 93.1 /100 | #127 | Exceptional 97.3% |
| Immigrants | Romania | 92.0 /100 | #128 | Exceptional 97.3% |
Demographics Similar to Nepalese by 6th Grade
In terms of 6th grade, the demographic groups most similar to Nepalese are Immigrants from Armenia (94.9%, a difference of 0.010%), Dominican (94.9%, a difference of 0.070%), Immigrants from Honduras (94.8%, a difference of 0.11%), Mexican American Indian (95.0%, a difference of 0.14%), and Honduran (95.0%, a difference of 0.14%).
| Demographics | Rating | Rank | 6th Grade |
| Central American Indians | 0.0 /100 | #323 | Tragic 95.1% |
| Cape Verdeans | 0.0 /100 | #324 | Tragic 95.1% |
| Immigrants | Nicaragua | 0.0 /100 | #325 | Tragic 95.1% |
| Hispanics or Latinos | 0.0 /100 | #326 | Tragic 95.0% |
| Mexican American Indians | 0.0 /100 | #327 | Tragic 95.0% |
| Hondurans | 0.0 /100 | #328 | Tragic 95.0% |
| Dominicans | 0.0 /100 | #329 | Tragic 94.9% |
| Nepalese | 0.0 /100 | #330 | Tragic 94.9% |
| Immigrants | Armenia | 0.0 /100 | #331 | Tragic 94.9% |
| Immigrants | Honduras | 0.0 /100 | #332 | Tragic 94.8% |
| Immigrants | Latin America | 0.0 /100 | #333 | Tragic 94.7% |
| Immigrants | Azores | 0.0 /100 | #334 | Tragic 94.7% |
| Mexicans | 0.0 /100 | #335 | Tragic 94.6% |
| Immigrants | Dominican Republic | 0.0 /100 | #336 | Tragic 94.6% |
| Central Americans | 0.0 /100 | #337 | Tragic 94.5% |