Immigrants from Norway vs Maltese 6th Grade
COMPARE
Immigrants from Norway
Maltese
6th Grade
6th Grade Comparison
Immigrants from Norway
Maltese
97.4%
6TH GRADE
94.7/ 100
METRIC RATING
121st/ 347
METRIC RANK
97.8%
6TH GRADE
99.8/ 100
METRIC RATING
51st/ 347
METRIC RANK
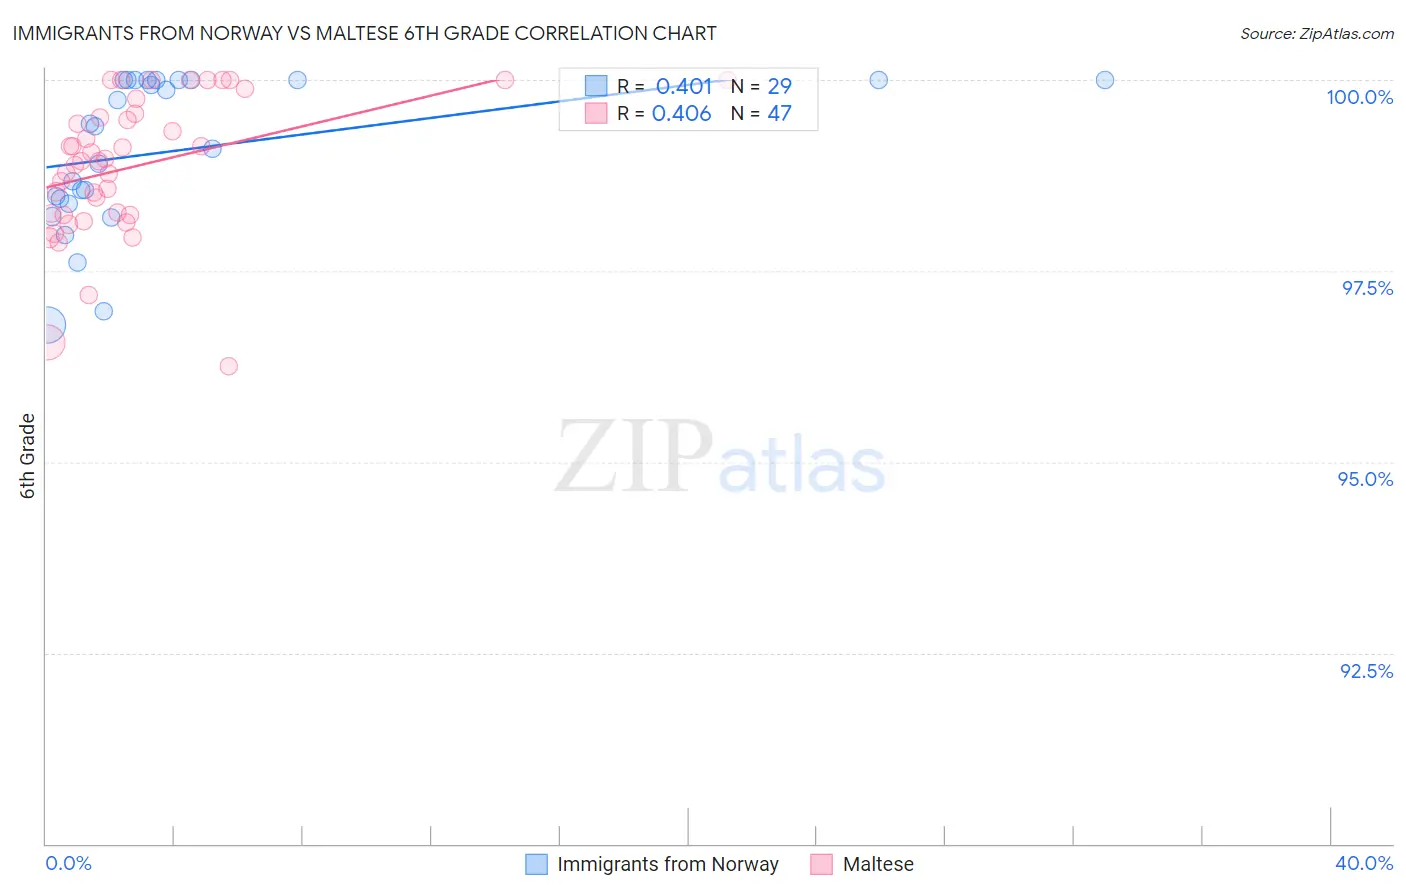
Immigrants from Norway vs Maltese 6th Grade Correlation Chart
The statistical analysis conducted on geographies consisting of 116,716,420 people shows a moderate positive correlation between the proportion of Immigrants from Norway and percentage of population with at least 6th grade education in the United States with a correlation coefficient (R) of 0.401 and weighted average of 97.4%. Similarly, the statistical analysis conducted on geographies consisting of 126,476,608 people shows a moderate positive correlation between the proportion of Maltese and percentage of population with at least 6th grade education in the United States with a correlation coefficient (R) of 0.406 and weighted average of 97.8%, a difference of 0.40%.
6th Grade Correlation Summary
| Measurement | Immigrants from Norway | Maltese |
| Minimum | 96.8% | 96.3% |
| Maximum | 100.0% | 100.0% |
| Range | 3.2% | 3.7% |
| Mean | 99.1% | 98.9% |
| Median | 99.4% | 98.9% |
| Interquartile 25% (IQ1) | 98.4% | 98.2% |
| Interquartile 75% (IQ3) | 100.0% | 99.6% |
| Interquartile Range (IQR) | 1.6% | 1.3% |
| Standard Deviation (Sample) | 0.98% | 0.91% |
| Standard Deviation (Population) | 0.97% | 0.90% |
Similar Demographics by 6th Grade
Demographics Similar to Immigrants from Norway by 6th Grade
In terms of 6th grade, the demographic groups most similar to Immigrants from Norway are Syrian (97.4%, a difference of 0.0%), Immigrants from France (97.4%, a difference of 0.0%), Immigrants from Japan (97.4%, a difference of 0.010%), Immigrants from Zimbabwe (97.4%, a difference of 0.010%), and Hmong (97.4%, a difference of 0.010%).
| Demographics | Rating | Rank | 6th Grade |
| Colville | 96.4 /100 | #114 | Exceptional 97.4% |
| Immigrants | Switzerland | 95.7 /100 | #115 | Exceptional 97.4% |
| Lebanese | 95.5 /100 | #116 | Exceptional 97.4% |
| Basques | 95.4 /100 | #117 | Exceptional 97.4% |
| Immigrants | Japan | 95.2 /100 | #118 | Exceptional 97.4% |
| Immigrants | Zimbabwe | 95.0 /100 | #119 | Exceptional 97.4% |
| Syrians | 94.8 /100 | #120 | Exceptional 97.4% |
| Immigrants | Norway | 94.7 /100 | #121 | Exceptional 97.4% |
| Immigrants | France | 94.5 /100 | #122 | Exceptional 97.4% |
| Hmong | 94.4 /100 | #123 | Exceptional 97.4% |
| Okinawans | 94.2 /100 | #124 | Exceptional 97.4% |
| Spanish | 93.7 /100 | #125 | Exceptional 97.3% |
| Immigrants | Bulgaria | 93.6 /100 | #126 | Exceptional 97.3% |
| Immigrants | Croatia | 93.1 /100 | #127 | Exceptional 97.3% |
| Immigrants | Romania | 92.0 /100 | #128 | Exceptional 97.3% |
Demographics Similar to Maltese by 6th Grade
In terms of 6th grade, the demographic groups most similar to Maltese are Australian (97.8%, a difference of 0.0%), Slavic (97.8%, a difference of 0.0%), Native Hawaiian (97.8%, a difference of 0.010%), Celtic (97.8%, a difference of 0.010%), and Estonian (97.8%, a difference of 0.010%).
| Demographics | Rating | Rank | 6th Grade |
| Czechoslovakians | 99.9 /100 | #44 | Exceptional 97.8% |
| Bulgarians | 99.9 /100 | #45 | Exceptional 97.8% |
| Arapaho | 99.9 /100 | #46 | Exceptional 97.8% |
| Native Hawaiians | 99.9 /100 | #47 | Exceptional 97.8% |
| Celtics | 99.9 /100 | #48 | Exceptional 97.8% |
| Estonians | 99.8 /100 | #49 | Exceptional 97.8% |
| Immigrants | Scotland | 99.8 /100 | #50 | Exceptional 97.8% |
| Maltese | 99.8 /100 | #51 | Exceptional 97.8% |
| Australians | 99.8 /100 | #52 | Exceptional 97.8% |
| Slavs | 99.8 /100 | #53 | Exceptional 97.8% |
| Creek | 99.8 /100 | #54 | Exceptional 97.7% |
| Aleuts | 99.8 /100 | #55 | Exceptional 97.7% |
| Austrians | 99.8 /100 | #56 | Exceptional 97.7% |
| Whites/Caucasians | 99.8 /100 | #57 | Exceptional 97.7% |
| Greeks | 99.8 /100 | #58 | Exceptional 97.7% |