Immigrants from Northern Africa vs Estonian 7th Grade
COMPARE
Immigrants from Northern Africa
Estonian
7th Grade
7th Grade Comparison
Immigrants from Northern Africa
Estonians
95.8%
7TH GRADE
21.4/ 100
METRIC RATING
202nd/ 347
METRIC RANK
97.0%
7TH GRADE
99.9/ 100
METRIC RATING
51st/ 347
METRIC RANK
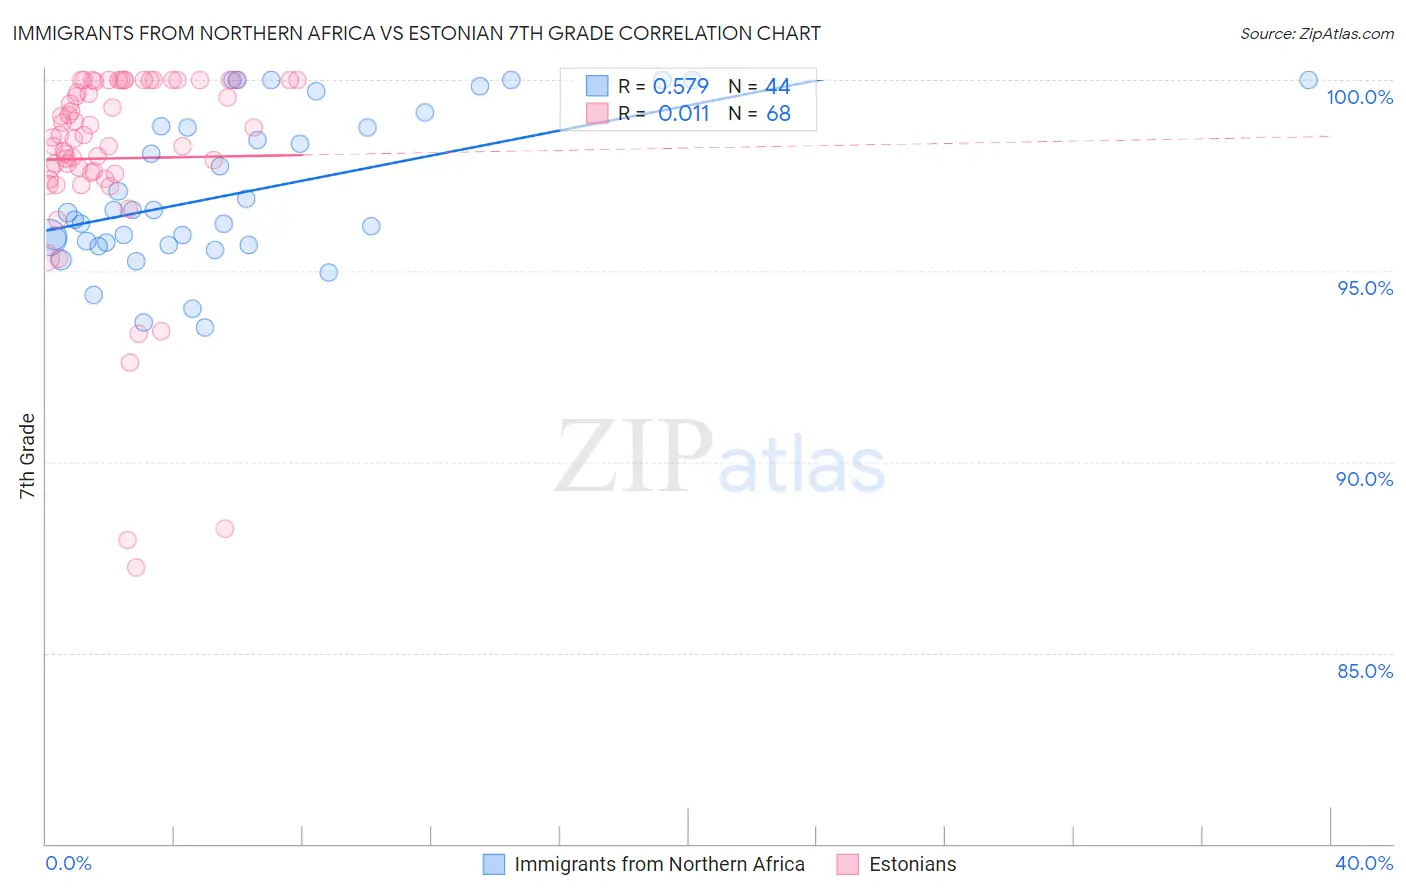
Immigrants from Northern Africa vs Estonian 7th Grade Correlation Chart
The statistical analysis conducted on geographies consisting of 321,196,768 people shows a substantial positive correlation between the proportion of Immigrants from Northern Africa and percentage of population with at least 7th grade education in the United States with a correlation coefficient (R) of 0.579 and weighted average of 95.8%. Similarly, the statistical analysis conducted on geographies consisting of 123,528,404 people shows no correlation between the proportion of Estonians and percentage of population with at least 7th grade education in the United States with a correlation coefficient (R) of 0.011 and weighted average of 97.0%, a difference of 1.2%.
7th Grade Correlation Summary
| Measurement | Immigrants from Northern Africa | Estonian |
| Minimum | 93.5% | 87.2% |
| Maximum | 100.0% | 100.0% |
| Range | 6.5% | 12.8% |
| Mean | 97.1% | 97.9% |
| Median | 96.6% | 98.5% |
| Interquartile 25% (IQ1) | 95.7% | 97.6% |
| Interquartile 75% (IQ3) | 98.8% | 100.0% |
| Interquartile Range (IQR) | 3.1% | 2.4% |
| Standard Deviation (Sample) | 2.0% | 2.7% |
| Standard Deviation (Population) | 1.9% | 2.7% |
Similar Demographics by 7th Grade
Demographics Similar to Immigrants from Northern Africa by 7th Grade
In terms of 7th grade, the demographic groups most similar to Immigrants from Northern Africa are Immigrants from Argentina (95.9%, a difference of 0.0%), Comanche (95.8%, a difference of 0.0%), Assyrian/Chaldean/Syriac (95.8%, a difference of 0.010%), Guamanian/Chamorro (95.9%, a difference of 0.020%), and Argentinean (95.9%, a difference of 0.020%).
| Demographics | Rating | Rank | 7th Grade |
| Sudanese | 28.1 /100 | #195 | Fair 95.9% |
| Apache | 27.6 /100 | #196 | Fair 95.9% |
| Immigrants | Zaire | 26.7 /100 | #197 | Fair 95.9% |
| Paraguayans | 24.8 /100 | #198 | Fair 95.9% |
| Guamanians/Chamorros | 23.5 /100 | #199 | Fair 95.9% |
| Argentineans | 23.2 /100 | #200 | Fair 95.9% |
| Immigrants | Argentina | 21.9 /100 | #201 | Fair 95.9% |
| Immigrants | Northern Africa | 21.4 /100 | #202 | Fair 95.8% |
| Comanche | 21.1 /100 | #203 | Fair 95.8% |
| Assyrians/Chaldeans/Syriacs | 20.5 /100 | #204 | Fair 95.8% |
| Moroccans | 18.9 /100 | #205 | Poor 95.8% |
| Africans | 17.6 /100 | #206 | Poor 95.8% |
| Navajo | 17.0 /100 | #207 | Poor 95.8% |
| Immigrants | Sudan | 17.0 /100 | #208 | Poor 95.8% |
| Dutch West Indians | 16.1 /100 | #209 | Poor 95.8% |
Demographics Similar to Estonians by 7th Grade
In terms of 7th grade, the demographic groups most similar to Estonians are Greek (97.0%, a difference of 0.020%), Slavic (97.1%, a difference of 0.030%), Immigrants from Scotland (97.1%, a difference of 0.030%), Austrian (97.0%, a difference of 0.030%), and Celtic (97.1%, a difference of 0.040%).
| Demographics | Rating | Rank | 7th Grade |
| Northern Europeans | 99.9 /100 | #44 | Exceptional 97.1% |
| Czechoslovakians | 99.9 /100 | #45 | Exceptional 97.1% |
| Aleuts | 99.9 /100 | #46 | Exceptional 97.1% |
| Bulgarians | 99.9 /100 | #47 | Exceptional 97.1% |
| Celtics | 99.9 /100 | #48 | Exceptional 97.1% |
| Slavs | 99.9 /100 | #49 | Exceptional 97.1% |
| Immigrants | Scotland | 99.9 /100 | #50 | Exceptional 97.1% |
| Estonians | 99.9 /100 | #51 | Exceptional 97.0% |
| Greeks | 99.9 /100 | #52 | Exceptional 97.0% |
| Austrians | 99.8 /100 | #53 | Exceptional 97.0% |
| Australians | 99.8 /100 | #54 | Exceptional 97.0% |
| Russians | 99.8 /100 | #55 | Exceptional 97.0% |
| Serbians | 99.8 /100 | #56 | Exceptional 97.0% |
| Americans | 99.8 /100 | #57 | Exceptional 97.0% |
| Whites/Caucasians | 99.8 /100 | #58 | Exceptional 97.0% |