European vs Estonian 7th Grade
COMPARE
European
Estonian
7th Grade
7th Grade Comparison
Europeans
Estonians
97.3%
7TH GRADE
100.0/ 100
METRIC RATING
31st/ 347
METRIC RANK
97.0%
7TH GRADE
99.9/ 100
METRIC RATING
51st/ 347
METRIC RANK
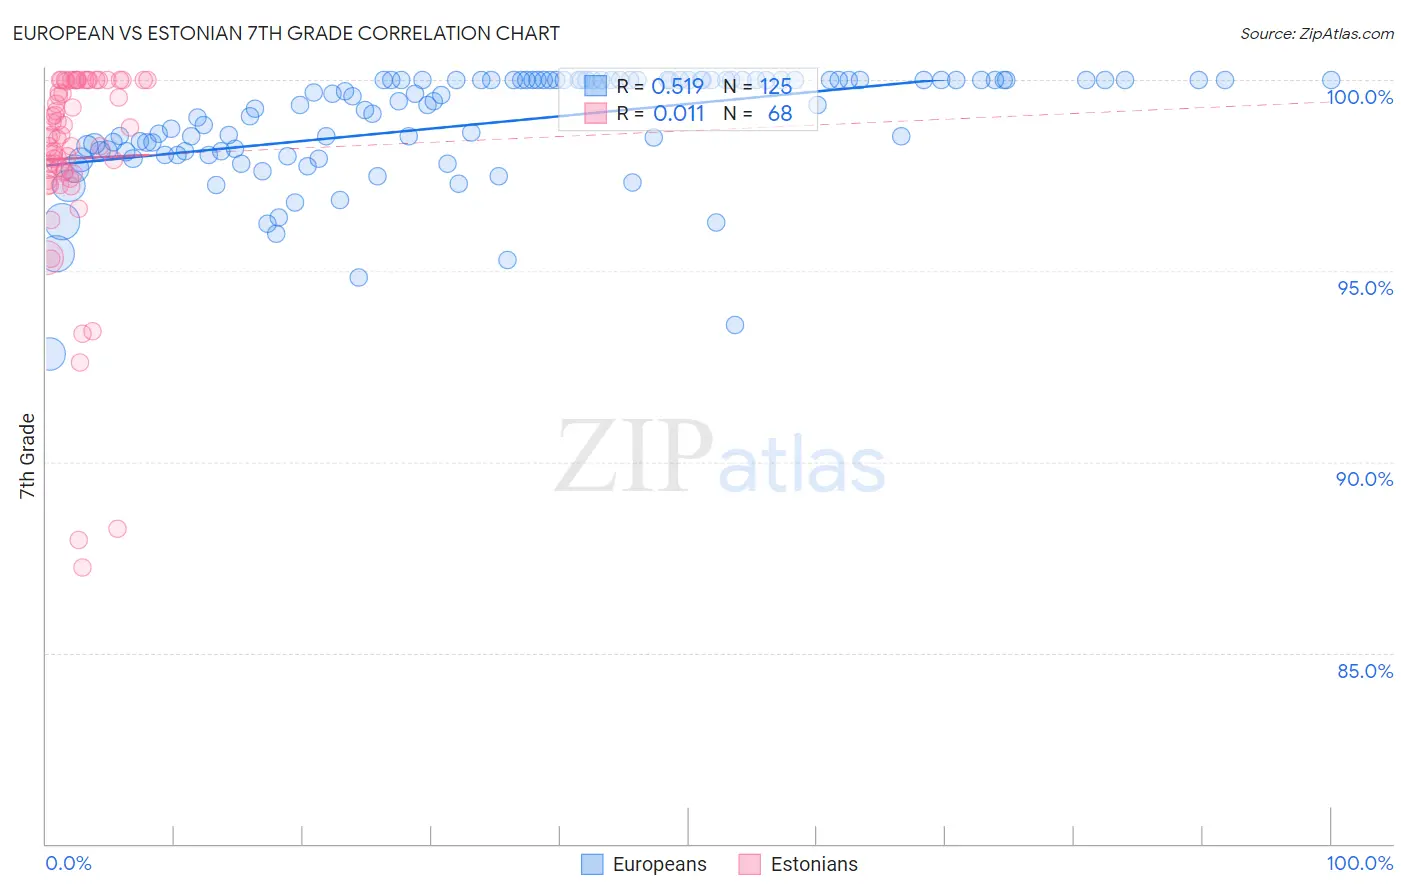
European vs Estonian 7th Grade Correlation Chart
The statistical analysis conducted on geographies consisting of 561,829,544 people shows a substantial positive correlation between the proportion of Europeans and percentage of population with at least 7th grade education in the United States with a correlation coefficient (R) of 0.519 and weighted average of 97.3%. Similarly, the statistical analysis conducted on geographies consisting of 123,528,404 people shows no correlation between the proportion of Estonians and percentage of population with at least 7th grade education in the United States with a correlation coefficient (R) of 0.011 and weighted average of 97.0%, a difference of 0.32%.
7th Grade Correlation Summary
| Measurement | European | Estonian |
| Minimum | 92.8% | 87.2% |
| Maximum | 100.0% | 100.0% |
| Range | 7.2% | 12.8% |
| Mean | 98.9% | 97.9% |
| Median | 99.5% | 98.5% |
| Interquartile 25% (IQ1) | 98.1% | 97.6% |
| Interquartile 75% (IQ3) | 100.0% | 100.0% |
| Interquartile Range (IQR) | 1.9% | 2.4% |
| Standard Deviation (Sample) | 1.4% | 2.7% |
| Standard Deviation (Population) | 1.4% | 2.7% |
Demographics Similar to Europeans and Estonians by 7th Grade
In terms of 7th grade, the demographic groups most similar to Europeans are Italian (97.3%, a difference of 0.0%), Chippewa (97.3%, a difference of 0.010%), Alaska Native (97.3%, a difference of 0.040%), Swiss (97.3%, a difference of 0.070%), and Hungarian (97.2%, a difference of 0.11%). Similarly, the demographic groups most similar to Estonians are Slavic (97.1%, a difference of 0.030%), Immigrants from Scotland (97.1%, a difference of 0.030%), Celtic (97.1%, a difference of 0.040%), Bulgarian (97.1%, a difference of 0.050%), and Czechoslovakian (97.1%, a difference of 0.070%).
| Demographics | Rating | Rank | 7th Grade |
| Europeans | 100.0 /100 | #31 | Exceptional 97.3% |
| Italians | 100.0 /100 | #32 | Exceptional 97.3% |
| Chippewa | 100.0 /100 | #33 | Exceptional 97.3% |
| Alaska Natives | 100.0 /100 | #34 | Exceptional 97.3% |
| Swiss | 100.0 /100 | #35 | Exceptional 97.3% |
| Hungarians | 100.0 /100 | #36 | Exceptional 97.2% |
| British | 100.0 /100 | #37 | Exceptional 97.2% |
| Belgians | 100.0 /100 | #38 | Exceptional 97.2% |
| Latvians | 100.0 /100 | #39 | Exceptional 97.2% |
| Luxembourgers | 100.0 /100 | #40 | Exceptional 97.2% |
| Eastern Europeans | 100.0 /100 | #41 | Exceptional 97.2% |
| Chinese | 99.9 /100 | #42 | Exceptional 97.1% |
| Maltese | 99.9 /100 | #43 | Exceptional 97.1% |
| Northern Europeans | 99.9 /100 | #44 | Exceptional 97.1% |
| Czechoslovakians | 99.9 /100 | #45 | Exceptional 97.1% |
| Aleuts | 99.9 /100 | #46 | Exceptional 97.1% |
| Bulgarians | 99.9 /100 | #47 | Exceptional 97.1% |
| Celtics | 99.9 /100 | #48 | Exceptional 97.1% |
| Slavs | 99.9 /100 | #49 | Exceptional 97.1% |
| Immigrants | Scotland | 99.9 /100 | #50 | Exceptional 97.1% |
| Estonians | 99.9 /100 | #51 | Exceptional 97.0% |