Immigrants from North Macedonia vs Japanese 7th Grade
COMPARE
Immigrants from North Macedonia
Japanese
7th Grade
7th Grade Comparison
Immigrants from North Macedonia
Japanese
96.4%
7TH GRADE
93.1/ 100
METRIC RATING
129th/ 347
METRIC RANK
94.0%
7TH GRADE
0.0/ 100
METRIC RATING
314th/ 347
METRIC RANK
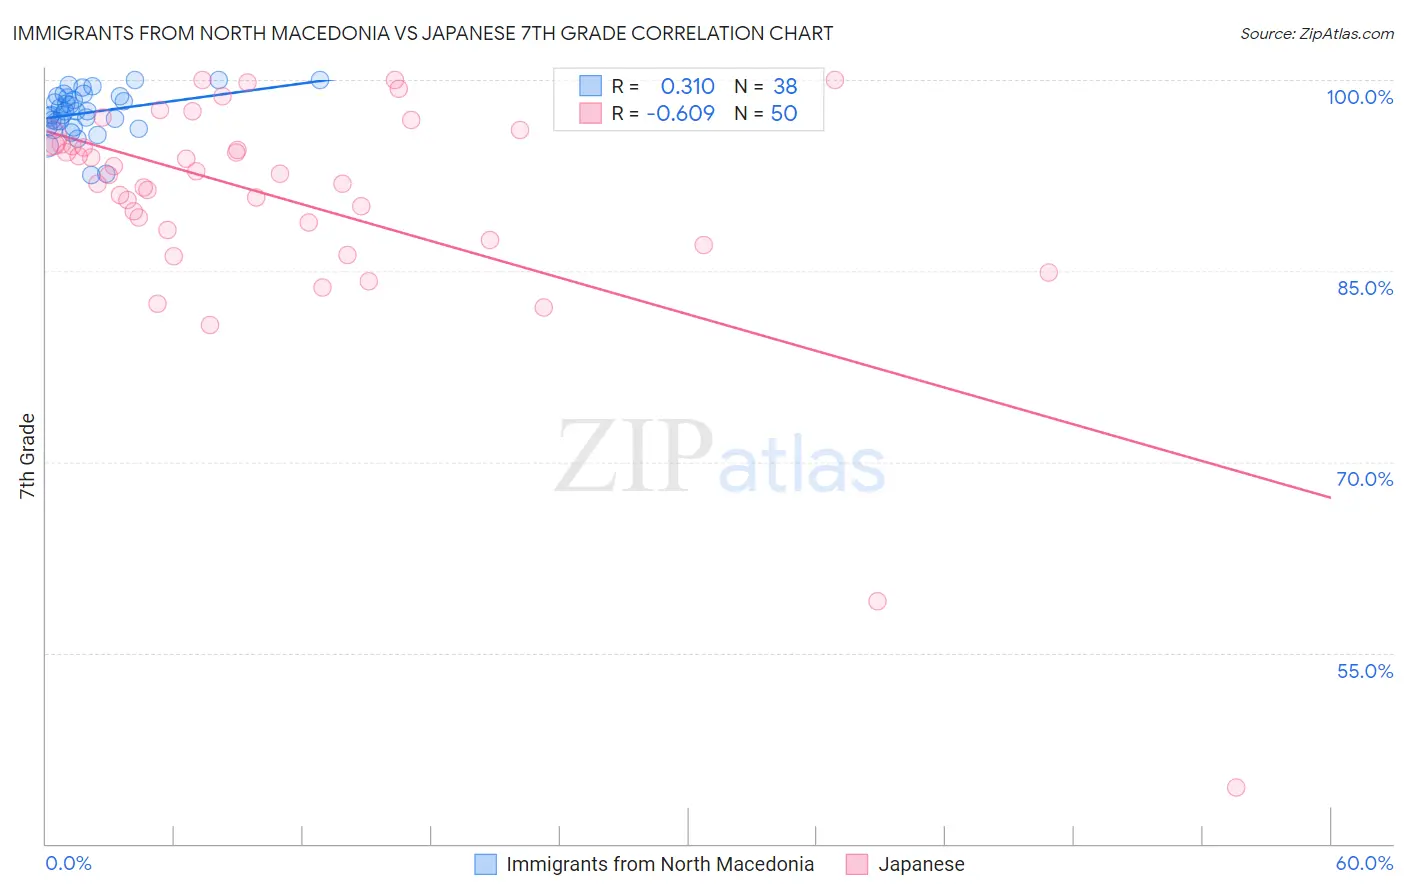
Immigrants from North Macedonia vs Japanese 7th Grade Correlation Chart
The statistical analysis conducted on geographies consisting of 74,317,186 people shows a mild positive correlation between the proportion of Immigrants from North Macedonia and percentage of population with at least 7th grade education in the United States with a correlation coefficient (R) of 0.310 and weighted average of 96.4%. Similarly, the statistical analysis conducted on geographies consisting of 249,183,224 people shows a significant negative correlation between the proportion of Japanese and percentage of population with at least 7th grade education in the United States with a correlation coefficient (R) of -0.609 and weighted average of 94.0%, a difference of 2.6%.
7th Grade Correlation Summary
| Measurement | Immigrants from North Macedonia | Japanese |
| Minimum | 92.6% | 44.4% |
| Maximum | 100.0% | 100.0% |
| Range | 7.4% | 55.6% |
| Mean | 97.4% | 90.5% |
| Median | 97.5% | 92.6% |
| Interquartile 25% (IQ1) | 96.3% | 88.2% |
| Interquartile 75% (IQ3) | 98.7% | 95.0% |
| Interquartile Range (IQR) | 2.4% | 6.8% |
| Standard Deviation (Sample) | 1.8% | 9.5% |
| Standard Deviation (Population) | 1.7% | 9.4% |
Similar Demographics by 7th Grade
Demographics Similar to Immigrants from North Macedonia by 7th Grade
In terms of 7th grade, the demographic groups most similar to Immigrants from North Macedonia are Immigrants from Romania (96.4%, a difference of 0.0%), Palestinian (96.4%, a difference of 0.010%), Immigrants from Bosnia and Herzegovina (96.4%, a difference of 0.010%), Immigrants from Serbia (96.4%, a difference of 0.010%), and Immigrants from Bulgaria (96.4%, a difference of 0.020%).
| Demographics | Rating | Rank | 7th Grade |
| Immigrants | Europe | 94.8 /100 | #122 | Exceptional 96.5% |
| Immigrants | France | 94.7 /100 | #123 | Exceptional 96.5% |
| Immigrants | Switzerland | 94.5 /100 | #124 | Exceptional 96.5% |
| Immigrants | Bulgaria | 94.0 /100 | #125 | Exceptional 96.4% |
| Palestinians | 93.5 /100 | #126 | Exceptional 96.4% |
| Immigrants | Bosnia and Herzegovina | 93.3 /100 | #127 | Exceptional 96.4% |
| Immigrants | Romania | 93.2 /100 | #128 | Exceptional 96.4% |
| Immigrants | North Macedonia | 93.1 /100 | #129 | Exceptional 96.4% |
| Immigrants | Serbia | 92.8 /100 | #130 | Exceptional 96.4% |
| Filipinos | 92.1 /100 | #131 | Exceptional 96.4% |
| Colville | 91.7 /100 | #132 | Exceptional 96.4% |
| Hmong | 91.5 /100 | #133 | Exceptional 96.4% |
| Soviet Union | 91.2 /100 | #134 | Exceptional 96.4% |
| Immigrants | Kuwait | 91.1 /100 | #135 | Exceptional 96.4% |
| Immigrants | Hungary | 90.6 /100 | #136 | Exceptional 96.4% |
Demographics Similar to Japanese by 7th Grade
In terms of 7th grade, the demographic groups most similar to Japanese are Immigrants (94.0%, a difference of 0.030%), Immigrants from Bangladesh (94.0%, a difference of 0.030%), Vietnamese (93.9%, a difference of 0.050%), Puerto Rican (94.0%, a difference of 0.070%), and Immigrants from Caribbean (94.0%, a difference of 0.080%).
| Demographics | Rating | Rank | 7th Grade |
| Immigrants | Portugal | 0.0 /100 | #307 | Tragic 94.2% |
| Cape Verdeans | 0.0 /100 | #308 | Tragic 94.1% |
| Ecuadorians | 0.0 /100 | #309 | Tragic 94.0% |
| Immigrants | Caribbean | 0.0 /100 | #310 | Tragic 94.0% |
| Puerto Ricans | 0.0 /100 | #311 | Tragic 94.0% |
| Immigrants | Immigrants | 0.0 /100 | #312 | Tragic 94.0% |
| Immigrants | Bangladesh | 0.0 /100 | #313 | Tragic 94.0% |
| Japanese | 0.0 /100 | #314 | Tragic 94.0% |
| Vietnamese | 0.0 /100 | #315 | Tragic 93.9% |
| Immigrants | Vietnam | 0.0 /100 | #316 | Tragic 93.9% |
| Immigrants | Cuba | 0.0 /100 | #317 | Tragic 93.8% |
| Immigrants | Ecuador | 0.0 /100 | #318 | Tragic 93.7% |
| Immigrants | Cambodia | 0.0 /100 | #319 | Tragic 93.7% |
| Immigrants | Fiji | 0.0 /100 | #320 | Tragic 93.5% |
| Belizeans | 0.0 /100 | #321 | Tragic 93.5% |