Immigrants from North Macedonia vs Immigrants from Norway 7th Grade
COMPARE
Immigrants from North Macedonia
Immigrants from Norway
7th Grade
7th Grade Comparison
Immigrants from North Macedonia
Immigrants from Norway
96.4%
7TH GRADE
93.1/ 100
METRIC RATING
129th/ 347
METRIC RANK
96.5%
7TH GRADE
95.2/ 100
METRIC RATING
119th/ 347
METRIC RANK
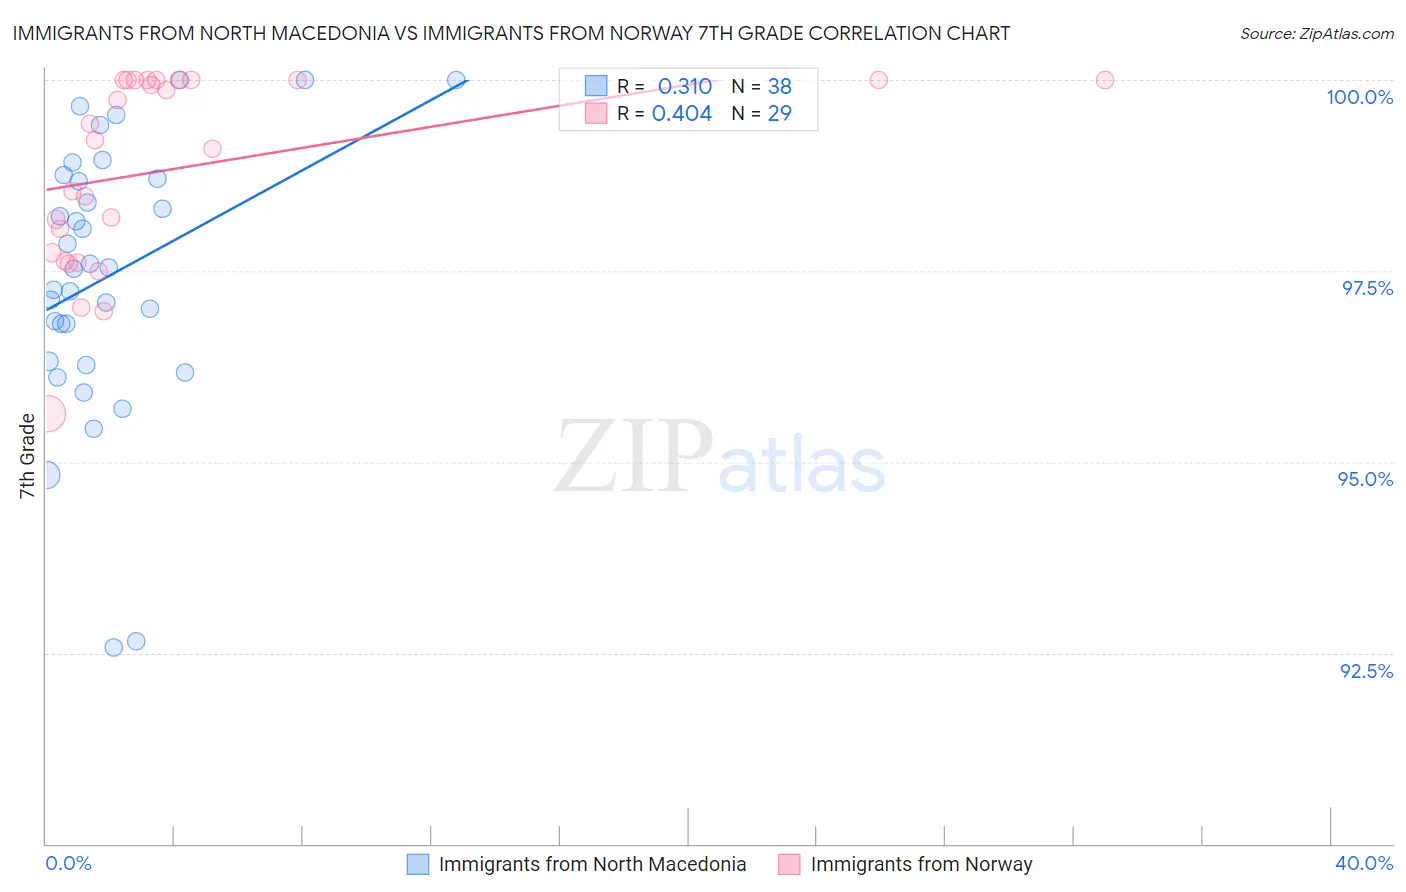
Immigrants from North Macedonia vs Immigrants from Norway 7th Grade Correlation Chart
The statistical analysis conducted on geographies consisting of 74,317,186 people shows a mild positive correlation between the proportion of Immigrants from North Macedonia and percentage of population with at least 7th grade education in the United States with a correlation coefficient (R) of 0.310 and weighted average of 96.4%. Similarly, the statistical analysis conducted on geographies consisting of 116,716,420 people shows a moderate positive correlation between the proportion of Immigrants from Norway and percentage of population with at least 7th grade education in the United States with a correlation coefficient (R) of 0.404 and weighted average of 96.5%, a difference of 0.060%.
7th Grade Correlation Summary
| Measurement | Immigrants from North Macedonia | Immigrants from Norway |
| Minimum | 92.6% | 95.6% |
| Maximum | 100.0% | 100.0% |
| Range | 7.4% | 4.4% |
| Mean | 97.4% | 98.8% |
| Median | 97.5% | 99.2% |
| Interquartile 25% (IQ1) | 96.3% | 97.7% |
| Interquartile 75% (IQ3) | 98.7% | 100.0% |
| Interquartile Range (IQR) | 2.4% | 2.3% |
| Standard Deviation (Sample) | 1.8% | 1.2% |
| Standard Deviation (Population) | 1.7% | 1.2% |
Demographics Similar to Immigrants from North Macedonia and Immigrants from Norway by 7th Grade
In terms of 7th grade, the demographic groups most similar to Immigrants from North Macedonia are Immigrants from Romania (96.4%, a difference of 0.0%), Palestinian (96.4%, a difference of 0.010%), Immigrants from Bosnia and Herzegovina (96.4%, a difference of 0.010%), Immigrants from Serbia (96.4%, a difference of 0.010%), and Immigrants from Bulgaria (96.4%, a difference of 0.020%). Similarly, the demographic groups most similar to Immigrants from Norway are Immigrants from Japan (96.5%, a difference of 0.010%), Immigrants from Croatia (96.5%, a difference of 0.010%), Cheyenne (96.5%, a difference of 0.010%), Immigrants from Europe (96.5%, a difference of 0.010%), and Immigrants from Moldova (96.5%, a difference of 0.020%).
| Demographics | Rating | Rank | 7th Grade |
| Immigrants | Zimbabwe | 96.6 /100 | #114 | Exceptional 96.5% |
| Choctaw | 96.6 /100 | #115 | Exceptional 96.5% |
| Syrians | 96.6 /100 | #116 | Exceptional 96.5% |
| Immigrants | Moldova | 95.7 /100 | #117 | Exceptional 96.5% |
| Immigrants | Japan | 95.5 /100 | #118 | Exceptional 96.5% |
| Immigrants | Norway | 95.2 /100 | #119 | Exceptional 96.5% |
| Immigrants | Croatia | 95.0 /100 | #120 | Exceptional 96.5% |
| Cheyenne | 94.9 /100 | #121 | Exceptional 96.5% |
| Immigrants | Europe | 94.8 /100 | #122 | Exceptional 96.5% |
| Immigrants | France | 94.7 /100 | #123 | Exceptional 96.5% |
| Immigrants | Switzerland | 94.5 /100 | #124 | Exceptional 96.5% |
| Immigrants | Bulgaria | 94.0 /100 | #125 | Exceptional 96.4% |
| Palestinians | 93.5 /100 | #126 | Exceptional 96.4% |
| Immigrants | Bosnia and Herzegovina | 93.3 /100 | #127 | Exceptional 96.4% |
| Immigrants | Romania | 93.2 /100 | #128 | Exceptional 96.4% |
| Immigrants | North Macedonia | 93.1 /100 | #129 | Exceptional 96.4% |
| Immigrants | Serbia | 92.8 /100 | #130 | Exceptional 96.4% |
| Filipinos | 92.1 /100 | #131 | Exceptional 96.4% |
| Colville | 91.7 /100 | #132 | Exceptional 96.4% |
| Hmong | 91.5 /100 | #133 | Exceptional 96.4% |
| Soviet Union | 91.2 /100 | #134 | Exceptional 96.4% |