Immigrants from Nicaragua vs Venezuelan 12th Grade, No Diploma
COMPARE
Immigrants from Nicaragua
Venezuelan
12th Grade, No Diploma
12th Grade, No Diploma Comparison
Immigrants from Nicaragua
Venezuelans
86.6%
12TH GRADE, NO DIPLOMA
0.0/ 100
METRIC RATING
320th/ 347
METRIC RANK
91.7%
12TH GRADE, NO DIPLOMA
88.2/ 100
METRIC RATING
134th/ 347
METRIC RANK
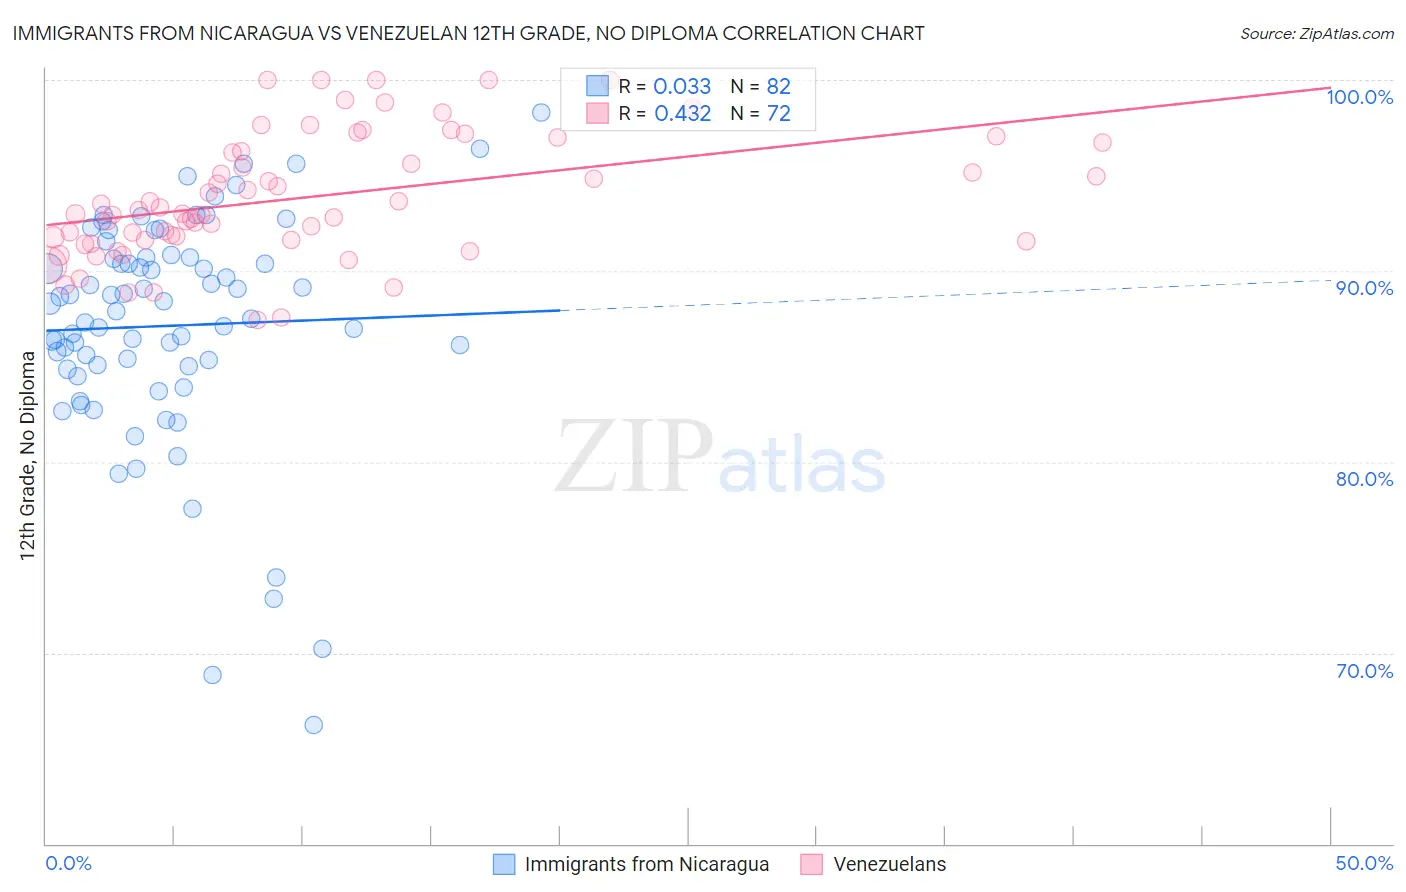
Immigrants from Nicaragua vs Venezuelan 12th Grade, No Diploma Correlation Chart
The statistical analysis conducted on geographies consisting of 236,340,506 people shows no correlation between the proportion of Immigrants from Nicaragua and percentage of population with at least 12th grade (no diploma) education in the United States with a correlation coefficient (R) of 0.033 and weighted average of 86.6%. Similarly, the statistical analysis conducted on geographies consisting of 306,323,887 people shows a moderate positive correlation between the proportion of Venezuelans and percentage of population with at least 12th grade (no diploma) education in the United States with a correlation coefficient (R) of 0.432 and weighted average of 91.7%, a difference of 6.0%.
12th Grade, No Diploma Correlation Summary
| Measurement | Immigrants from Nicaragua | Venezuelan |
| Minimum | 66.2% | 87.4% |
| Maximum | 98.3% | 100.0% |
| Range | 32.1% | 12.6% |
| Mean | 87.1% | 93.9% |
| Median | 88.1% | 93.1% |
| Interquartile 25% (IQ1) | 85.0% | 91.6% |
| Interquartile 75% (IQ3) | 90.7% | 96.5% |
| Interquartile Range (IQR) | 5.7% | 4.9% |
| Standard Deviation (Sample) | 6.0% | 3.2% |
| Standard Deviation (Population) | 5.9% | 3.2% |
Similar Demographics by 12th Grade, No Diploma
Demographics Similar to Immigrants from Nicaragua by 12th Grade, No Diploma
In terms of 12th grade, no diploma, the demographic groups most similar to Immigrants from Nicaragua are Puerto Rican (86.5%, a difference of 0.030%), Central American Indian (86.5%, a difference of 0.10%), Yuman (86.5%, a difference of 0.11%), Immigrants from Belize (87.0%, a difference of 0.46%), and Belizean (87.0%, a difference of 0.54%).
| Demographics | Rating | Rank | 12th Grade, No Diploma |
| Immigrants | Caribbean | 0.0 /100 | #313 | Tragic 87.4% |
| Cape Verdeans | 0.0 /100 | #314 | Tragic 87.4% |
| Nicaraguans | 0.0 /100 | #315 | Tragic 87.3% |
| Apache | 0.0 /100 | #316 | Tragic 87.3% |
| Navajo | 0.0 /100 | #317 | Tragic 87.1% |
| Belizeans | 0.0 /100 | #318 | Tragic 87.0% |
| Immigrants | Belize | 0.0 /100 | #319 | Tragic 87.0% |
| Immigrants | Nicaragua | 0.0 /100 | #320 | Tragic 86.6% |
| Puerto Ricans | 0.0 /100 | #321 | Tragic 86.5% |
| Central American Indians | 0.0 /100 | #322 | Tragic 86.5% |
| Yuman | 0.0 /100 | #323 | Tragic 86.5% |
| Immigrants | Cabo Verde | 0.0 /100 | #324 | Tragic 85.8% |
| Mexican American Indians | 0.0 /100 | #325 | Tragic 85.7% |
| Dominicans | 0.0 /100 | #326 | Tragic 85.7% |
| Lumbee | 0.0 /100 | #327 | Tragic 85.7% |
Demographics Similar to Venezuelans by 12th Grade, No Diploma
In terms of 12th grade, no diploma, the demographic groups most similar to Venezuelans are Immigrants from Italy (91.7%, a difference of 0.0%), Albanian (91.8%, a difference of 0.030%), Immigrants from Eastern Asia (91.8%, a difference of 0.030%), Immigrants from Bosnia and Herzegovina (91.7%, a difference of 0.030%), and Assyrian/Chaldean/Syriac (91.8%, a difference of 0.040%).
| Demographics | Rating | Rank | 12th Grade, No Diploma |
| Immigrants | Jordan | 91.0 /100 | #127 | Exceptional 91.8% |
| Mongolians | 89.9 /100 | #128 | Excellent 91.8% |
| German Russians | 89.8 /100 | #129 | Excellent 91.8% |
| Assyrians/Chaldeans/Syriacs | 89.6 /100 | #130 | Excellent 91.8% |
| Albanians | 89.3 /100 | #131 | Excellent 91.8% |
| Immigrants | Eastern Asia | 89.3 /100 | #132 | Excellent 91.8% |
| Immigrants | Italy | 88.3 /100 | #133 | Excellent 91.7% |
| Venezuelans | 88.2 /100 | #134 | Excellent 91.7% |
| Immigrants | Bosnia and Herzegovina | 87.3 /100 | #135 | Excellent 91.7% |
| Chileans | 85.8 /100 | #136 | Excellent 91.7% |
| Alaska Natives | 84.9 /100 | #137 | Excellent 91.6% |
| Arabs | 84.1 /100 | #138 | Excellent 91.6% |
| Immigrants | Egypt | 83.9 /100 | #139 | Excellent 91.6% |
| Immigrants | Poland | 82.3 /100 | #140 | Excellent 91.6% |
| Argentineans | 82.0 /100 | #141 | Excellent 91.6% |