Immigrants from Nicaragua vs Sierra Leonean 12th Grade, No Diploma
COMPARE
Immigrants from Nicaragua
Sierra Leonean
12th Grade, No Diploma
12th Grade, No Diploma Comparison
Immigrants from Nicaragua
Sierra Leoneans
86.6%
12TH GRADE, NO DIPLOMA
0.0/ 100
METRIC RATING
320th/ 347
METRIC RANK
91.1%
12TH GRADE, NO DIPLOMA
47.7/ 100
METRIC RATING
177th/ 347
METRIC RANK
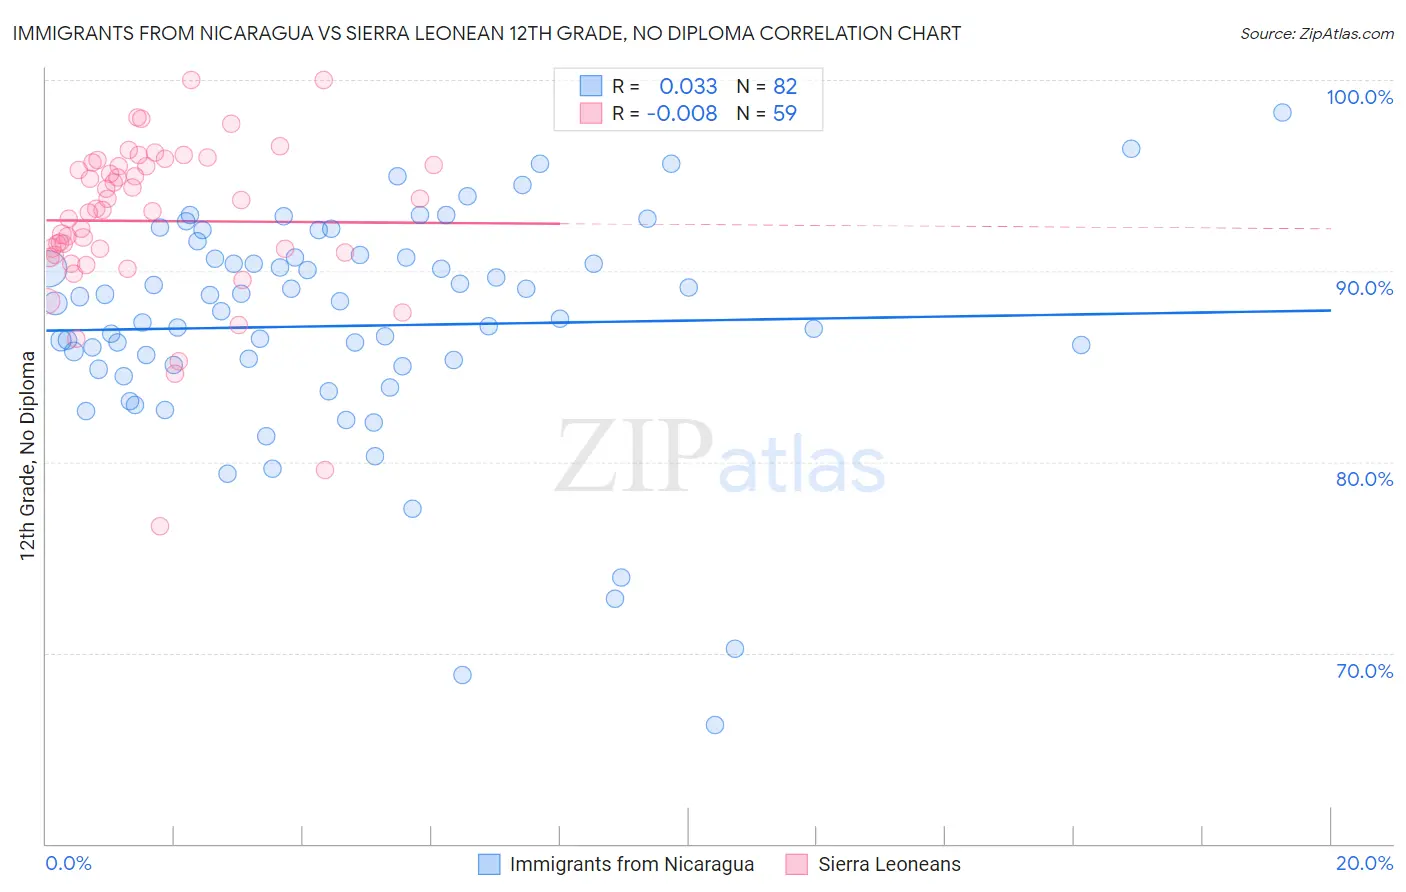
Immigrants from Nicaragua vs Sierra Leonean 12th Grade, No Diploma Correlation Chart
The statistical analysis conducted on geographies consisting of 236,340,506 people shows no correlation between the proportion of Immigrants from Nicaragua and percentage of population with at least 12th grade (no diploma) education in the United States with a correlation coefficient (R) of 0.033 and weighted average of 86.6%. Similarly, the statistical analysis conducted on geographies consisting of 83,363,012 people shows no correlation between the proportion of Sierra Leoneans and percentage of population with at least 12th grade (no diploma) education in the United States with a correlation coefficient (R) of -0.008 and weighted average of 91.1%, a difference of 5.3%.
12th Grade, No Diploma Correlation Summary
| Measurement | Immigrants from Nicaragua | Sierra Leonean |
| Minimum | 66.2% | 76.6% |
| Maximum | 98.3% | 100.0% |
| Range | 32.1% | 23.4% |
| Mean | 87.1% | 92.6% |
| Median | 88.1% | 93.2% |
| Interquartile 25% (IQ1) | 85.0% | 90.9% |
| Interquartile 75% (IQ3) | 90.7% | 95.5% |
| Interquartile Range (IQR) | 5.7% | 4.7% |
| Standard Deviation (Sample) | 6.0% | 4.3% |
| Standard Deviation (Population) | 5.9% | 4.3% |
Similar Demographics by 12th Grade, No Diploma
Demographics Similar to Immigrants from Nicaragua by 12th Grade, No Diploma
In terms of 12th grade, no diploma, the demographic groups most similar to Immigrants from Nicaragua are Puerto Rican (86.5%, a difference of 0.030%), Central American Indian (86.5%, a difference of 0.10%), Yuman (86.5%, a difference of 0.11%), Immigrants from Belize (87.0%, a difference of 0.46%), and Belizean (87.0%, a difference of 0.54%).
| Demographics | Rating | Rank | 12th Grade, No Diploma |
| Immigrants | Caribbean | 0.0 /100 | #313 | Tragic 87.4% |
| Cape Verdeans | 0.0 /100 | #314 | Tragic 87.4% |
| Nicaraguans | 0.0 /100 | #315 | Tragic 87.3% |
| Apache | 0.0 /100 | #316 | Tragic 87.3% |
| Navajo | 0.0 /100 | #317 | Tragic 87.1% |
| Belizeans | 0.0 /100 | #318 | Tragic 87.0% |
| Immigrants | Belize | 0.0 /100 | #319 | Tragic 87.0% |
| Immigrants | Nicaragua | 0.0 /100 | #320 | Tragic 86.6% |
| Puerto Ricans | 0.0 /100 | #321 | Tragic 86.5% |
| Central American Indians | 0.0 /100 | #322 | Tragic 86.5% |
| Yuman | 0.0 /100 | #323 | Tragic 86.5% |
| Immigrants | Cabo Verde | 0.0 /100 | #324 | Tragic 85.8% |
| Mexican American Indians | 0.0 /100 | #325 | Tragic 85.7% |
| Dominicans | 0.0 /100 | #326 | Tragic 85.7% |
| Lumbee | 0.0 /100 | #327 | Tragic 85.7% |
Demographics Similar to Sierra Leoneans by 12th Grade, No Diploma
In terms of 12th grade, no diploma, the demographic groups most similar to Sierra Leoneans are Iroquois (91.1%, a difference of 0.010%), Immigrants from Western Asia (91.2%, a difference of 0.020%), Bolivian (91.2%, a difference of 0.030%), Immigrants from Nepal (91.2%, a difference of 0.030%), and Bermudan (91.2%, a difference of 0.040%).
| Demographics | Rating | Rank | 12th Grade, No Diploma |
| Delaware | 52.8 /100 | #170 | Average 91.2% |
| Immigrants | Morocco | 51.4 /100 | #171 | Average 91.2% |
| Bermudans | 50.8 /100 | #172 | Average 91.2% |
| Bolivians | 50.4 /100 | #173 | Average 91.2% |
| Immigrants | Nepal | 50.0 /100 | #174 | Average 91.2% |
| Immigrants | Western Asia | 49.0 /100 | #175 | Average 91.2% |
| Iroquois | 48.5 /100 | #176 | Average 91.1% |
| Sierra Leoneans | 47.7 /100 | #177 | Average 91.1% |
| Spanish | 43.7 /100 | #178 | Average 91.1% |
| Immigrants | Chile | 43.3 /100 | #179 | Average 91.1% |
| Immigrants | Syria | 40.3 /100 | #180 | Average 91.1% |
| Guamanians/Chamorros | 39.5 /100 | #181 | Fair 91.0% |
| Immigrants | Nonimmigrants | 38.8 /100 | #182 | Fair 91.0% |
| Osage | 38.3 /100 | #183 | Fair 91.0% |
| Spaniards | 36.2 /100 | #184 | Fair 91.0% |