Immigrants from Nicaragua vs Iraqi 5th Grade
COMPARE
Immigrants from Nicaragua
Iraqi
5th Grade
5th Grade Comparison
Immigrants from Nicaragua
Iraqis
95.6%
5TH GRADE
0.0/ 100
METRIC RATING
322nd/ 347
METRIC RANK
97.1%
5TH GRADE
10.9/ 100
METRIC RATING
207th/ 347
METRIC RANK
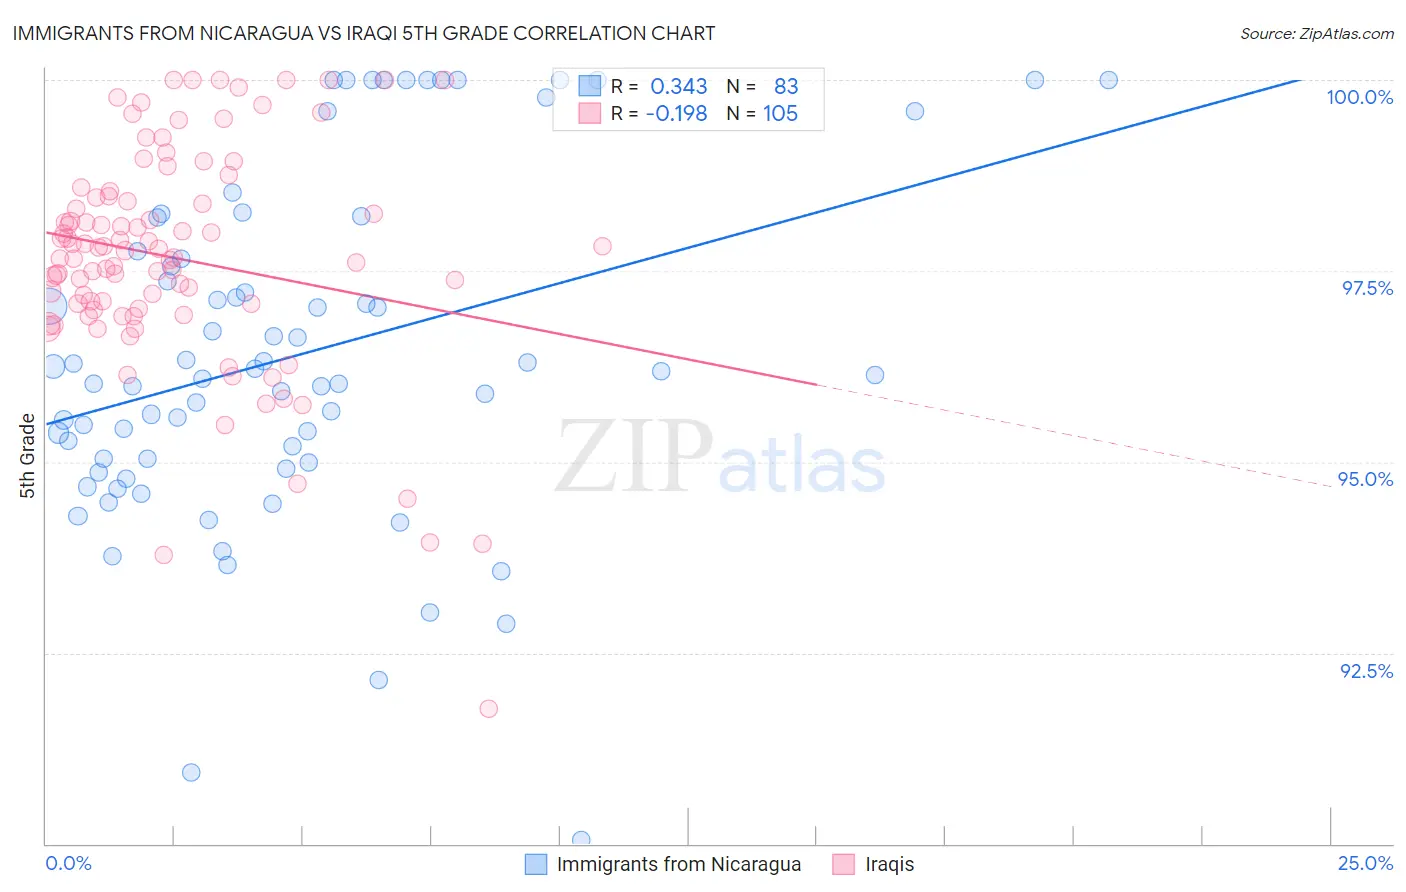
Immigrants from Nicaragua vs Iraqi 5th Grade Correlation Chart
The statistical analysis conducted on geographies consisting of 236,340,656 people shows a mild positive correlation between the proportion of Immigrants from Nicaragua and percentage of population with at least 5th grade education in the United States with a correlation coefficient (R) of 0.343 and weighted average of 95.6%. Similarly, the statistical analysis conducted on geographies consisting of 170,614,457 people shows a poor negative correlation between the proportion of Iraqis and percentage of population with at least 5th grade education in the United States with a correlation coefficient (R) of -0.198 and weighted average of 97.1%, a difference of 1.5%.
5th Grade Correlation Summary
| Measurement | Immigrants from Nicaragua | Iraqi |
| Minimum | 90.0% | 91.8% |
| Maximum | 100.0% | 100.0% |
| Range | 10.0% | 8.2% |
| Mean | 96.4% | 97.7% |
| Median | 96.1% | 97.8% |
| Interquartile 25% (IQ1) | 95.0% | 97.0% |
| Interquartile 75% (IQ3) | 97.8% | 98.5% |
| Interquartile Range (IQR) | 2.8% | 1.5% |
| Standard Deviation (Sample) | 2.2% | 1.5% |
| Standard Deviation (Population) | 2.2% | 1.5% |
Similar Demographics by 5th Grade
Demographics Similar to Immigrants from Nicaragua by 5th Grade
In terms of 5th grade, the demographic groups most similar to Immigrants from Nicaragua are Immigrants from Belize (95.7%, a difference of 0.020%), Immigrants from Fiji (95.6%, a difference of 0.050%), Honduran (95.6%, a difference of 0.070%), Hispanic or Latino (95.6%, a difference of 0.070%), and Japanese (95.7%, a difference of 0.090%).
| Demographics | Rating | Rank | 5th Grade |
| Nicaraguans | 0.0 /100 | #315 | Tragic 95.9% |
| Immigrants | Ecuador | 0.0 /100 | #316 | Tragic 95.8% |
| Belizeans | 0.0 /100 | #317 | Tragic 95.8% |
| Immigrants | Vietnam | 0.0 /100 | #318 | Tragic 95.8% |
| Japanese | 0.0 /100 | #319 | Tragic 95.7% |
| Central American Indians | 0.0 /100 | #320 | Tragic 95.7% |
| Immigrants | Belize | 0.0 /100 | #321 | Tragic 95.7% |
| Immigrants | Nicaragua | 0.0 /100 | #322 | Tragic 95.6% |
| Immigrants | Fiji | 0.0 /100 | #323 | Tragic 95.6% |
| Hondurans | 0.0 /100 | #324 | Tragic 95.6% |
| Hispanics or Latinos | 0.0 /100 | #325 | Tragic 95.6% |
| Immigrants | Cambodia | 0.0 /100 | #326 | Tragic 95.5% |
| Dominicans | 0.0 /100 | #327 | Tragic 95.5% |
| Cape Verdeans | 0.0 /100 | #328 | Tragic 95.5% |
| Mexican American Indians | 0.0 /100 | #329 | Tragic 95.5% |
Demographics Similar to Iraqis by 5th Grade
In terms of 5th grade, the demographic groups most similar to Iraqis are Laotian (97.1%, a difference of 0.0%), Moroccan (97.1%, a difference of 0.010%), Paiute (97.1%, a difference of 0.010%), Immigrants from Nepal (97.1%, a difference of 0.010%), and Immigrants from Oceania (97.1%, a difference of 0.010%).
| Demographics | Rating | Rank | 5th Grade |
| Immigrants | Northern Africa | 16.8 /100 | #200 | Poor 97.2% |
| Immigrants | Chile | 16.6 /100 | #201 | Poor 97.2% |
| Africans | 15.3 /100 | #202 | Poor 97.2% |
| Immigrants | Bahamas | 14.9 /100 | #203 | Poor 97.2% |
| Immigrants | Zaire | 13.7 /100 | #204 | Poor 97.1% |
| Moroccans | 12.0 /100 | #205 | Poor 97.1% |
| Paiute | 11.6 /100 | #206 | Poor 97.1% |
| Iraqis | 10.9 /100 | #207 | Poor 97.1% |
| Laotians | 10.8 /100 | #208 | Poor 97.1% |
| Immigrants | Nepal | 10.3 /100 | #209 | Poor 97.1% |
| Immigrants | Oceania | 10.0 /100 | #210 | Poor 97.1% |
| Samoans | 8.5 /100 | #211 | Tragic 97.1% |
| Immigrants | Iraq | 8.3 /100 | #212 | Tragic 97.1% |
| Portuguese | 7.8 /100 | #213 | Tragic 97.1% |
| Costa Ricans | 7.7 /100 | #214 | Tragic 97.1% |