Immigrants from Nicaragua vs Immigrants from Peru 5th Grade
COMPARE
Immigrants from Nicaragua
Immigrants from Peru
5th Grade
5th Grade Comparison
Immigrants from Nicaragua
Immigrants from Peru
95.6%
5TH GRADE
0.0/ 100
METRIC RATING
322nd/ 347
METRIC RANK
96.6%
5TH GRADE
0.1/ 100
METRIC RATING
275th/ 347
METRIC RANK
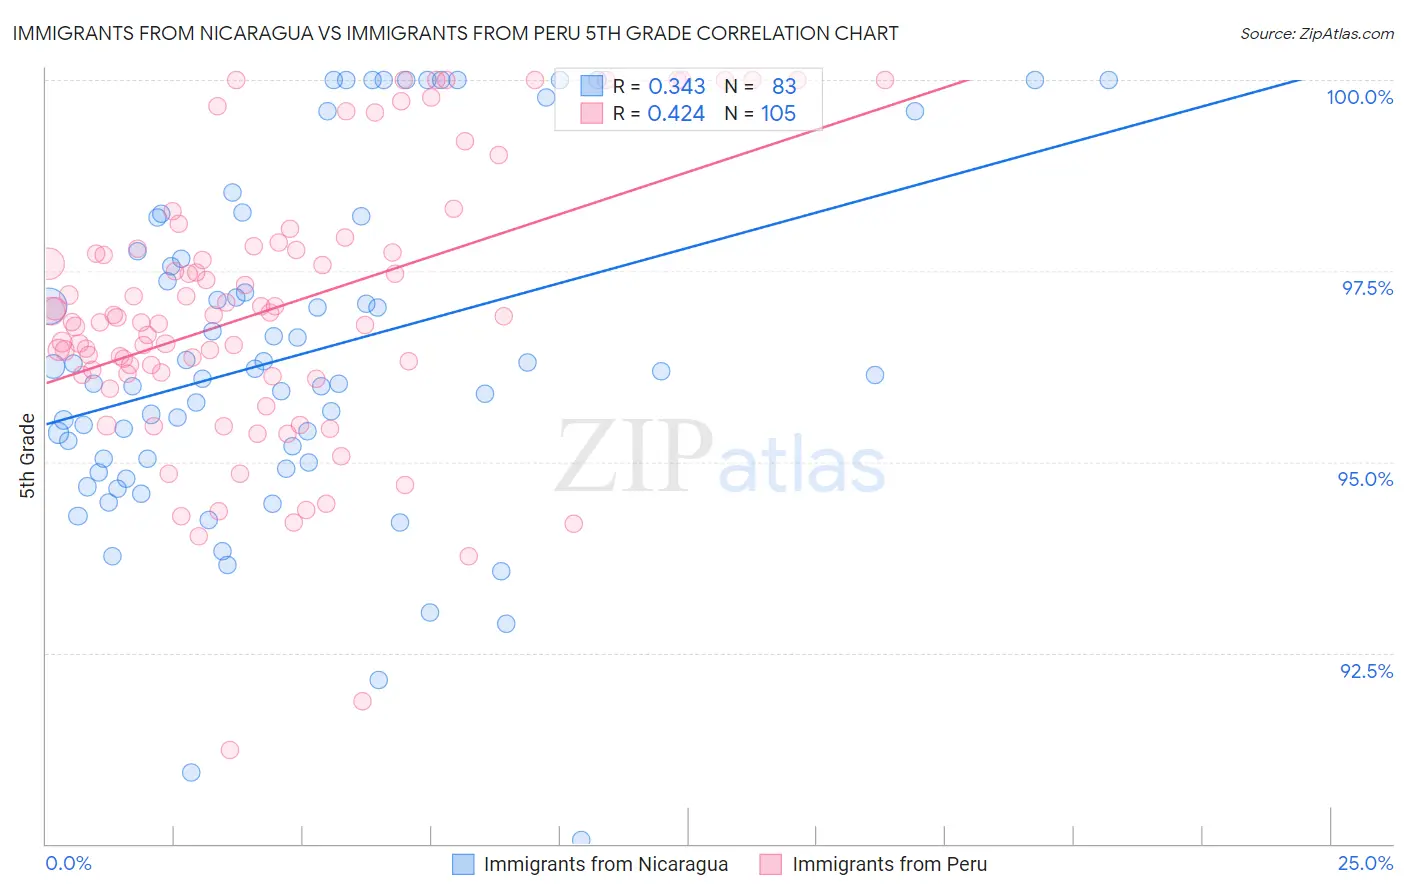
Immigrants from Nicaragua vs Immigrants from Peru 5th Grade Correlation Chart
The statistical analysis conducted on geographies consisting of 236,340,656 people shows a mild positive correlation between the proportion of Immigrants from Nicaragua and percentage of population with at least 5th grade education in the United States with a correlation coefficient (R) of 0.343 and weighted average of 95.6%. Similarly, the statistical analysis conducted on geographies consisting of 328,685,754 people shows a moderate positive correlation between the proportion of Immigrants from Peru and percentage of population with at least 5th grade education in the United States with a correlation coefficient (R) of 0.424 and weighted average of 96.6%, a difference of 1.1%.
5th Grade Correlation Summary
| Measurement | Immigrants from Nicaragua | Immigrants from Peru |
| Minimum | 90.0% | 91.2% |
| Maximum | 100.0% | 100.0% |
| Range | 10.0% | 8.8% |
| Mean | 96.4% | 97.0% |
| Median | 96.1% | 96.9% |
| Interquartile 25% (IQ1) | 95.0% | 96.2% |
| Interquartile 75% (IQ3) | 97.8% | 97.8% |
| Interquartile Range (IQR) | 2.8% | 1.7% |
| Standard Deviation (Sample) | 2.2% | 1.8% |
| Standard Deviation (Population) | 2.2% | 1.8% |
Similar Demographics by 5th Grade
Demographics Similar to Immigrants from Nicaragua by 5th Grade
In terms of 5th grade, the demographic groups most similar to Immigrants from Nicaragua are Immigrants from Belize (95.7%, a difference of 0.020%), Immigrants from Fiji (95.6%, a difference of 0.050%), Honduran (95.6%, a difference of 0.070%), Hispanic or Latino (95.6%, a difference of 0.070%), and Japanese (95.7%, a difference of 0.090%).
| Demographics | Rating | Rank | 5th Grade |
| Nicaraguans | 0.0 /100 | #315 | Tragic 95.9% |
| Immigrants | Ecuador | 0.0 /100 | #316 | Tragic 95.8% |
| Belizeans | 0.0 /100 | #317 | Tragic 95.8% |
| Immigrants | Vietnam | 0.0 /100 | #318 | Tragic 95.8% |
| Japanese | 0.0 /100 | #319 | Tragic 95.7% |
| Central American Indians | 0.0 /100 | #320 | Tragic 95.7% |
| Immigrants | Belize | 0.0 /100 | #321 | Tragic 95.7% |
| Immigrants | Nicaragua | 0.0 /100 | #322 | Tragic 95.6% |
| Immigrants | Fiji | 0.0 /100 | #323 | Tragic 95.6% |
| Hondurans | 0.0 /100 | #324 | Tragic 95.6% |
| Hispanics or Latinos | 0.0 /100 | #325 | Tragic 95.6% |
| Immigrants | Cambodia | 0.0 /100 | #326 | Tragic 95.5% |
| Dominicans | 0.0 /100 | #327 | Tragic 95.5% |
| Cape Verdeans | 0.0 /100 | #328 | Tragic 95.5% |
| Mexican American Indians | 0.0 /100 | #329 | Tragic 95.5% |
Demographics Similar to Immigrants from Peru by 5th Grade
In terms of 5th grade, the demographic groups most similar to Immigrants from Peru are Cuban (96.6%, a difference of 0.0%), Immigrants from Bolivia (96.6%, a difference of 0.0%), Yaqui (96.7%, a difference of 0.010%), Immigrants from Cameroon (96.7%, a difference of 0.010%), and Immigrants from Ghana (96.6%, a difference of 0.010%).
| Demographics | Rating | Rank | 5th Grade |
| Armenians | 0.3 /100 | #268 | Tragic 96.7% |
| Ghanaians | 0.2 /100 | #269 | Tragic 96.7% |
| Afghans | 0.2 /100 | #270 | Tragic 96.7% |
| Immigrants | Hong Kong | 0.2 /100 | #271 | Tragic 96.7% |
| Trinidadians and Tobagonians | 0.1 /100 | #272 | Tragic 96.7% |
| Yaqui | 0.1 /100 | #273 | Tragic 96.7% |
| Immigrants | Cameroon | 0.1 /100 | #274 | Tragic 96.7% |
| Immigrants | Peru | 0.1 /100 | #275 | Tragic 96.6% |
| Cubans | 0.1 /100 | #276 | Tragic 96.6% |
| Immigrants | Bolivia | 0.1 /100 | #277 | Tragic 96.6% |
| Immigrants | Ghana | 0.1 /100 | #278 | Tragic 96.6% |
| Immigrants | Philippines | 0.1 /100 | #279 | Tragic 96.6% |
| Immigrants | Western Africa | 0.1 /100 | #280 | Tragic 96.6% |
| Houma | 0.1 /100 | #281 | Tragic 96.6% |
| Barbadians | 0.1 /100 | #282 | Tragic 96.6% |