Immigrants from Laos vs Tlingit-Haida 7th Grade
COMPARE
Immigrants from Laos
Tlingit-Haida
7th Grade
7th Grade Comparison
Immigrants from Laos
Tlingit-Haida
94.5%
7TH GRADE
0.0/ 100
METRIC RATING
302nd/ 347
METRIC RANK
97.5%
7TH GRADE
100.0/ 100
METRIC RATING
18th/ 347
METRIC RANK
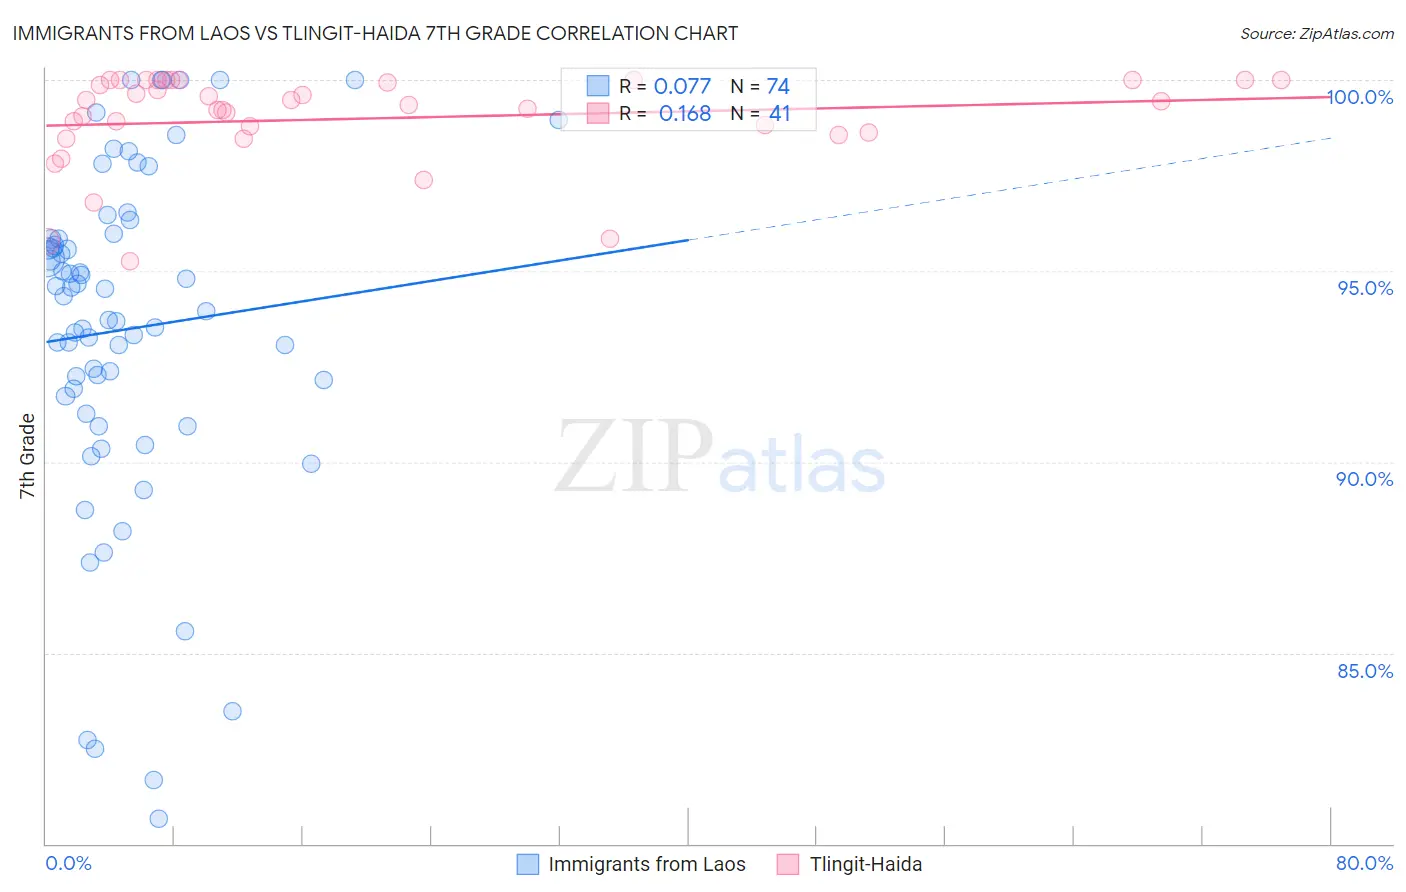
Immigrants from Laos vs Tlingit-Haida 7th Grade Correlation Chart
The statistical analysis conducted on geographies consisting of 201,472,886 people shows a slight positive correlation between the proportion of Immigrants from Laos and percentage of population with at least 7th grade education in the United States with a correlation coefficient (R) of 0.077 and weighted average of 94.5%. Similarly, the statistical analysis conducted on geographies consisting of 60,865,648 people shows a poor positive correlation between the proportion of Tlingit-Haida and percentage of population with at least 7th grade education in the United States with a correlation coefficient (R) of 0.168 and weighted average of 97.5%, a difference of 3.2%.
7th Grade Correlation Summary
| Measurement | Immigrants from Laos | Tlingit-Haida |
| Minimum | 80.6% | 95.2% |
| Maximum | 100.0% | 100.0% |
| Range | 19.4% | 4.8% |
| Mean | 93.5% | 99.0% |
| Median | 94.1% | 99.3% |
| Interquartile 25% (IQ1) | 91.7% | 98.6% |
| Interquartile 75% (IQ3) | 95.8% | 100.0% |
| Interquartile Range (IQR) | 4.1% | 1.4% |
| Standard Deviation (Sample) | 4.5% | 1.2% |
| Standard Deviation (Population) | 4.4% | 1.2% |
Similar Demographics by 7th Grade
Demographics Similar to Immigrants from Laos by 7th Grade
In terms of 7th grade, the demographic groups most similar to Immigrants from Laos are Immigrants from Dominica (94.5%, a difference of 0.0%), Immigrants from Burma/Myanmar (94.5%, a difference of 0.030%), Indonesian (94.5%, a difference of 0.070%), Bangladeshi (94.5%, a difference of 0.070%), and Immigrants from South Eastern Asia (94.5%, a difference of 0.080%).
| Demographics | Rating | Rank | 7th Grade |
| Yaqui | 0.0 /100 | #295 | Tragic 94.6% |
| Cubans | 0.0 /100 | #296 | Tragic 94.6% |
| Immigrants | South Eastern Asia | 0.0 /100 | #297 | Tragic 94.5% |
| Indonesians | 0.0 /100 | #298 | Tragic 94.5% |
| Bangladeshis | 0.0 /100 | #299 | Tragic 94.5% |
| Immigrants | Burma/Myanmar | 0.0 /100 | #300 | Tragic 94.5% |
| Immigrants | Dominica | 0.0 /100 | #301 | Tragic 94.5% |
| Immigrants | Laos | 0.0 /100 | #302 | Tragic 94.5% |
| Sri Lankans | 0.0 /100 | #303 | Tragic 94.4% |
| Immigrants | Haiti | 0.0 /100 | #304 | Tragic 94.3% |
| Guyanese | 0.0 /100 | #305 | Tragic 94.3% |
| Immigrants | Guyana | 0.0 /100 | #306 | Tragic 94.2% |
| Immigrants | Portugal | 0.0 /100 | #307 | Tragic 94.2% |
| Cape Verdeans | 0.0 /100 | #308 | Tragic 94.1% |
| Ecuadorians | 0.0 /100 | #309 | Tragic 94.0% |
Demographics Similar to Tlingit-Haida by 7th Grade
In terms of 7th grade, the demographic groups most similar to Tlingit-Haida are Scottish (97.5%, a difference of 0.010%), Lithuanian (97.5%, a difference of 0.010%), Irish (97.5%, a difference of 0.020%), Yup'ik (97.4%, a difference of 0.050%), and Inupiat (97.4%, a difference of 0.070%).
| Demographics | Rating | Rank | 7th Grade |
| Alaskan Athabascans | 100.0 /100 | #11 | Exceptional 97.6% |
| Poles | 100.0 /100 | #12 | Exceptional 97.6% |
| Swedes | 100.0 /100 | #13 | Exceptional 97.6% |
| Pennsylvania Germans | 100.0 /100 | #14 | Exceptional 97.6% |
| English | 100.0 /100 | #15 | Exceptional 97.6% |
| Irish | 100.0 /100 | #16 | Exceptional 97.5% |
| Scottish | 100.0 /100 | #17 | Exceptional 97.5% |
| Tlingit-Haida | 100.0 /100 | #18 | Exceptional 97.5% |
| Lithuanians | 100.0 /100 | #19 | Exceptional 97.5% |
| Yup'ik | 100.0 /100 | #20 | Exceptional 97.4% |
| Inupiat | 100.0 /100 | #21 | Exceptional 97.4% |
| French Canadians | 100.0 /100 | #22 | Exceptional 97.4% |
| Croatians | 100.0 /100 | #23 | Exceptional 97.4% |
| Welsh | 100.0 /100 | #24 | Exceptional 97.4% |
| French | 100.0 /100 | #25 | Exceptional 97.4% |