Immigrants from Kuwait vs Northern European 5th Grade
COMPARE
Immigrants from Kuwait
Northern European
5th Grade
5th Grade Comparison
Immigrants from Kuwait
Northern Europeans
97.6%
5TH GRADE
90.4/ 100
METRIC RATING
132nd/ 347
METRIC RANK
98.0%
5TH GRADE
99.9/ 100
METRIC RATING
42nd/ 347
METRIC RANK
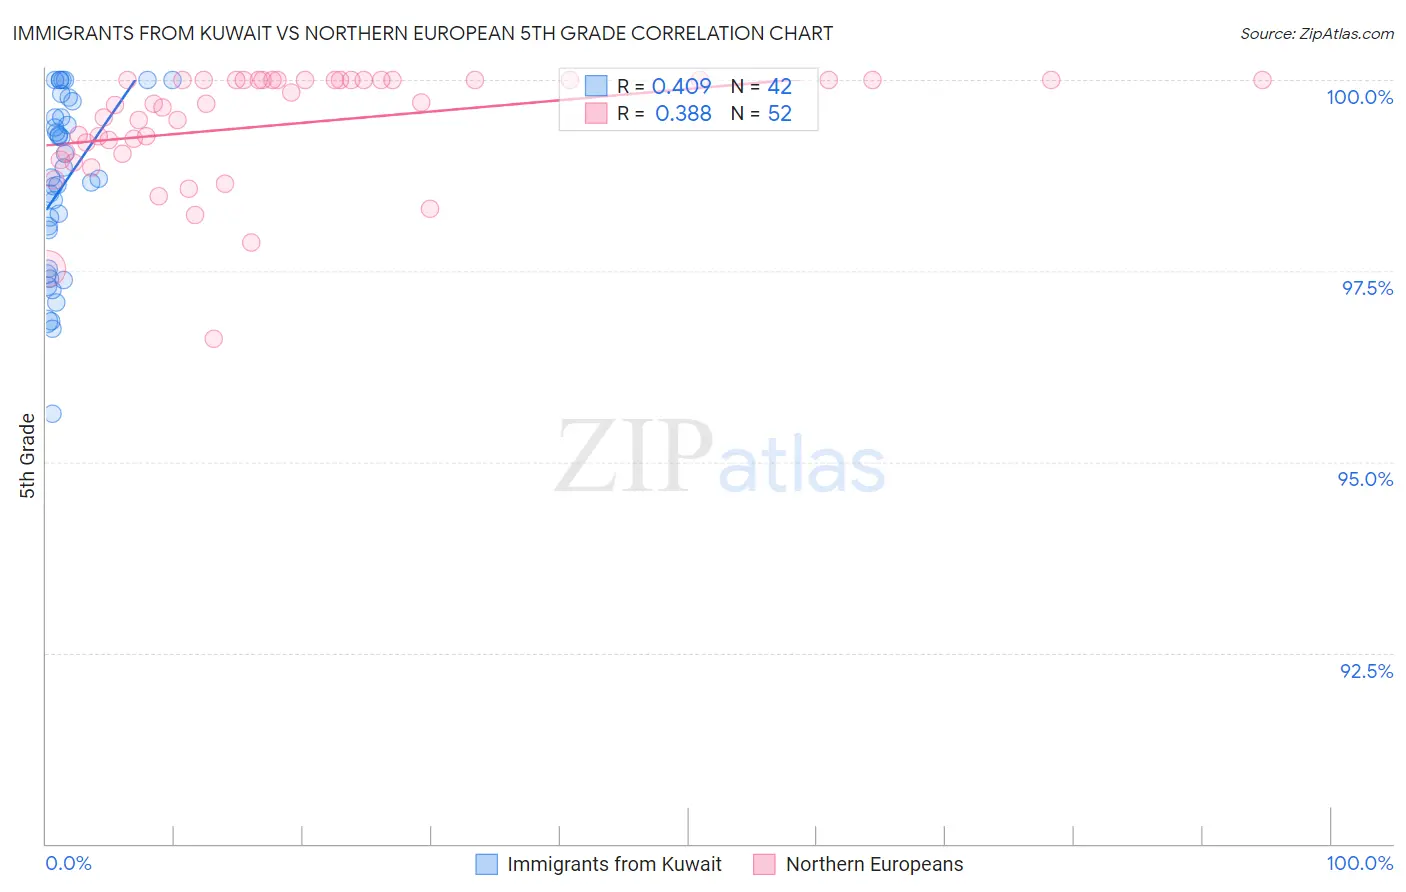
Immigrants from Kuwait vs Northern European 5th Grade Correlation Chart
The statistical analysis conducted on geographies consisting of 136,913,666 people shows a moderate positive correlation between the proportion of Immigrants from Kuwait and percentage of population with at least 5th grade education in the United States with a correlation coefficient (R) of 0.409 and weighted average of 97.6%. Similarly, the statistical analysis conducted on geographies consisting of 406,093,361 people shows a mild positive correlation between the proportion of Northern Europeans and percentage of population with at least 5th grade education in the United States with a correlation coefficient (R) of 0.388 and weighted average of 98.0%, a difference of 0.49%.
5th Grade Correlation Summary
| Measurement | Immigrants from Kuwait | Northern European |
| Minimum | 95.6% | 96.6% |
| Maximum | 100.0% | 100.0% |
| Range | 4.4% | 3.4% |
| Mean | 98.6% | 99.4% |
| Median | 98.7% | 99.7% |
| Interquartile 25% (IQ1) | 97.5% | 99.0% |
| Interquartile 75% (IQ3) | 99.5% | 100.0% |
| Interquartile Range (IQR) | 2.0% | 0.96% |
| Standard Deviation (Sample) | 1.1% | 0.75% |
| Standard Deviation (Population) | 1.1% | 0.74% |
Similar Demographics by 5th Grade
Demographics Similar to Immigrants from Kuwait by 5th Grade
In terms of 5th grade, the demographic groups most similar to Immigrants from Kuwait are Cambodian (97.6%, a difference of 0.0%), Immigrants from Hungary (97.6%, a difference of 0.0%), Pima (97.6%, a difference of 0.010%), Palestinian (97.5%, a difference of 0.010%), and Immigrants from Serbia (97.6%, a difference of 0.020%).
| Demographics | Rating | Rank | 5th Grade |
| Immigrants | Bulgaria | 93.1 /100 | #125 | Exceptional 97.6% |
| Hmong | 92.3 /100 | #126 | Exceptional 97.6% |
| Immigrants | Serbia | 92.3 /100 | #127 | Exceptional 97.6% |
| Colville | 92.0 /100 | #128 | Exceptional 97.6% |
| Immigrants | Europe | 91.9 /100 | #129 | Exceptional 97.6% |
| Immigrants | Romania | 91.6 /100 | #130 | Exceptional 97.6% |
| Pima | 91.2 /100 | #131 | Exceptional 97.6% |
| Immigrants | Kuwait | 90.4 /100 | #132 | Exceptional 97.6% |
| Cambodians | 90.2 /100 | #133 | Exceptional 97.6% |
| Immigrants | Hungary | 90.1 /100 | #134 | Exceptional 97.6% |
| Palestinians | 89.3 /100 | #135 | Excellent 97.5% |
| Immigrants | Moldova | 87.5 /100 | #136 | Excellent 97.5% |
| Filipinos | 86.8 /100 | #137 | Excellent 97.5% |
| Blackfeet | 86.8 /100 | #138 | Excellent 97.5% |
| Immigrants | Turkey | 86.7 /100 | #139 | Excellent 97.5% |
Demographics Similar to Northern Europeans by 5th Grade
In terms of 5th grade, the demographic groups most similar to Northern Europeans are Hungarian (98.0%, a difference of 0.010%), Ottawa (98.0%, a difference of 0.010%), Aleut (98.0%, a difference of 0.020%), Eastern European (98.1%, a difference of 0.030%), and Czechoslovakian (98.0%, a difference of 0.030%).
| Demographics | Rating | Rank | 5th Grade |
| Italians | 100.0 /100 | #35 | Exceptional 98.1% |
| British | 100.0 /100 | #36 | Exceptional 98.1% |
| Latvians | 99.9 /100 | #37 | Exceptional 98.1% |
| Belgians | 99.9 /100 | #38 | Exceptional 98.1% |
| Luxembourgers | 99.9 /100 | #39 | Exceptional 98.1% |
| Eastern Europeans | 99.9 /100 | #40 | Exceptional 98.1% |
| Hungarians | 99.9 /100 | #41 | Exceptional 98.0% |
| Northern Europeans | 99.9 /100 | #42 | Exceptional 98.0% |
| Ottawa | 99.9 /100 | #43 | Exceptional 98.0% |
| Aleuts | 99.9 /100 | #44 | Exceptional 98.0% |
| Czechoslovakians | 99.9 /100 | #45 | Exceptional 98.0% |
| Arapaho | 99.9 /100 | #46 | Exceptional 98.0% |
| Native Hawaiians | 99.9 /100 | #47 | Exceptional 98.0% |
| Bulgarians | 99.8 /100 | #48 | Exceptional 98.0% |
| Estonians | 99.8 /100 | #49 | Exceptional 98.0% |