Immigrants from Bolivia vs Northern European 5th Grade
COMPARE
Immigrants from Bolivia
Northern European
5th Grade
5th Grade Comparison
Immigrants from Bolivia
Northern Europeans
96.6%
5TH GRADE
0.1/ 100
METRIC RATING
277th/ 347
METRIC RANK
98.0%
5TH GRADE
99.9/ 100
METRIC RATING
42nd/ 347
METRIC RANK
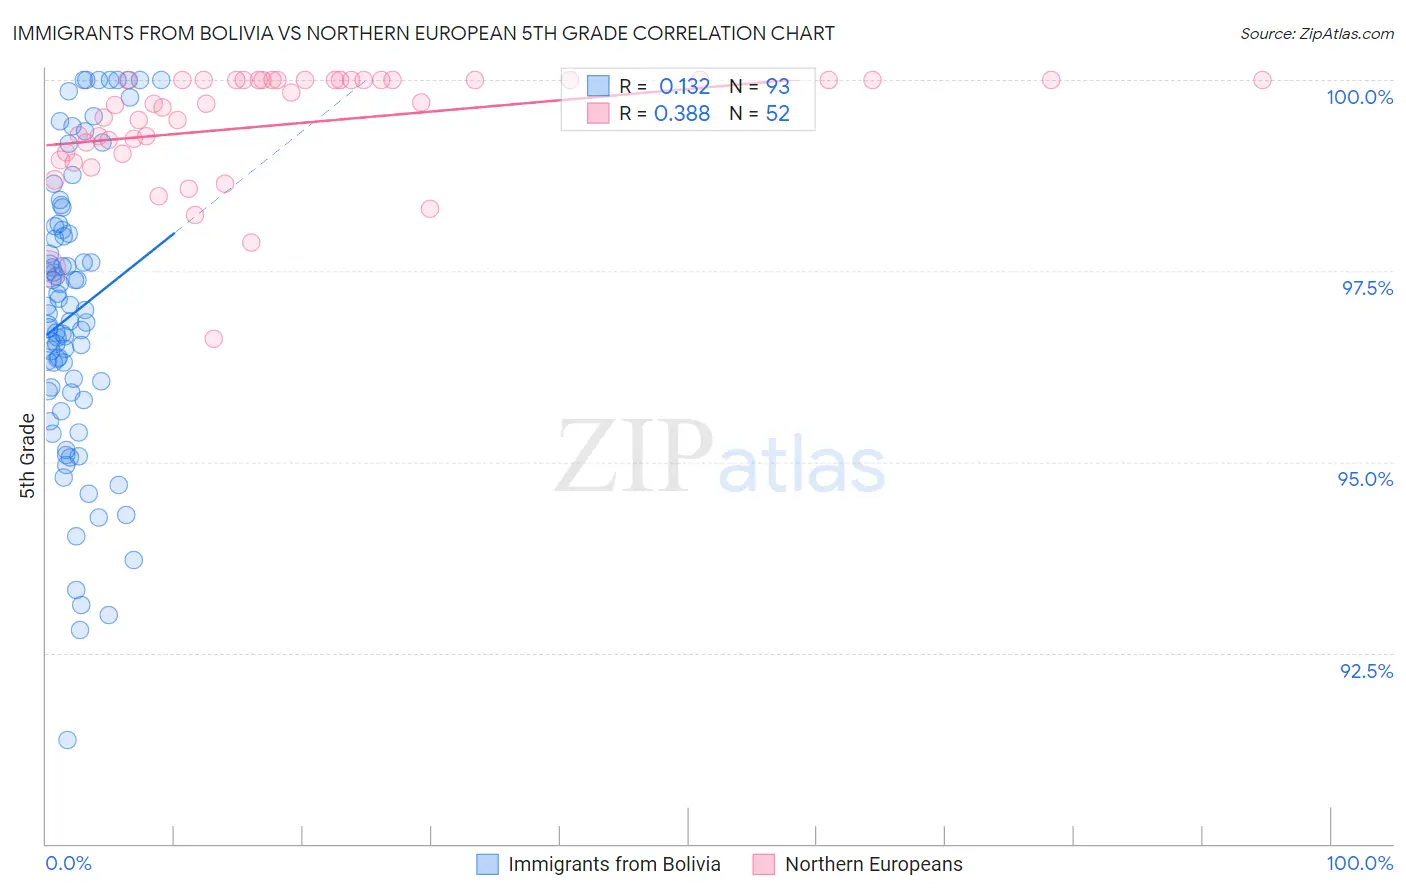
Immigrants from Bolivia vs Northern European 5th Grade Correlation Chart
The statistical analysis conducted on geographies consisting of 158,718,022 people shows a poor positive correlation between the proportion of Immigrants from Bolivia and percentage of population with at least 5th grade education in the United States with a correlation coefficient (R) of 0.132 and weighted average of 96.6%. Similarly, the statistical analysis conducted on geographies consisting of 406,093,361 people shows a mild positive correlation between the proportion of Northern Europeans and percentage of population with at least 5th grade education in the United States with a correlation coefficient (R) of 0.388 and weighted average of 98.0%, a difference of 1.4%.
5th Grade Correlation Summary
| Measurement | Immigrants from Bolivia | Northern European |
| Minimum | 91.4% | 96.6% |
| Maximum | 100.0% | 100.0% |
| Range | 8.6% | 3.4% |
| Mean | 96.9% | 99.4% |
| Median | 96.9% | 99.7% |
| Interquartile 25% (IQ1) | 95.9% | 99.0% |
| Interquartile 75% (IQ3) | 98.1% | 100.0% |
| Interquartile Range (IQR) | 2.1% | 0.96% |
| Standard Deviation (Sample) | 1.9% | 0.75% |
| Standard Deviation (Population) | 1.9% | 0.74% |
Similar Demographics by 5th Grade
Demographics Similar to Immigrants from Bolivia by 5th Grade
In terms of 5th grade, the demographic groups most similar to Immigrants from Bolivia are Immigrants from Peru (96.6%, a difference of 0.0%), Cuban (96.6%, a difference of 0.0%), Yaqui (96.7%, a difference of 0.010%), Immigrants from Cameroon (96.7%, a difference of 0.010%), and Immigrants from Ghana (96.6%, a difference of 0.010%).
| Demographics | Rating | Rank | 5th Grade |
| Afghans | 0.2 /100 | #270 | Tragic 96.7% |
| Immigrants | Hong Kong | 0.2 /100 | #271 | Tragic 96.7% |
| Trinidadians and Tobagonians | 0.1 /100 | #272 | Tragic 96.7% |
| Yaqui | 0.1 /100 | #273 | Tragic 96.7% |
| Immigrants | Cameroon | 0.1 /100 | #274 | Tragic 96.7% |
| Immigrants | Peru | 0.1 /100 | #275 | Tragic 96.6% |
| Cubans | 0.1 /100 | #276 | Tragic 96.6% |
| Immigrants | Bolivia | 0.1 /100 | #277 | Tragic 96.6% |
| Immigrants | Ghana | 0.1 /100 | #278 | Tragic 96.6% |
| Immigrants | Philippines | 0.1 /100 | #279 | Tragic 96.6% |
| Immigrants | Western Africa | 0.1 /100 | #280 | Tragic 96.6% |
| Houma | 0.1 /100 | #281 | Tragic 96.6% |
| Barbadians | 0.1 /100 | #282 | Tragic 96.6% |
| Fijians | 0.1 /100 | #283 | Tragic 96.6% |
| Immigrants | Trinidad and Tobago | 0.1 /100 | #284 | Tragic 96.6% |
Demographics Similar to Northern Europeans by 5th Grade
In terms of 5th grade, the demographic groups most similar to Northern Europeans are Hungarian (98.0%, a difference of 0.010%), Ottawa (98.0%, a difference of 0.010%), Aleut (98.0%, a difference of 0.020%), Eastern European (98.1%, a difference of 0.030%), and Czechoslovakian (98.0%, a difference of 0.030%).
| Demographics | Rating | Rank | 5th Grade |
| Italians | 100.0 /100 | #35 | Exceptional 98.1% |
| British | 100.0 /100 | #36 | Exceptional 98.1% |
| Latvians | 99.9 /100 | #37 | Exceptional 98.1% |
| Belgians | 99.9 /100 | #38 | Exceptional 98.1% |
| Luxembourgers | 99.9 /100 | #39 | Exceptional 98.1% |
| Eastern Europeans | 99.9 /100 | #40 | Exceptional 98.1% |
| Hungarians | 99.9 /100 | #41 | Exceptional 98.0% |
| Northern Europeans | 99.9 /100 | #42 | Exceptional 98.0% |
| Ottawa | 99.9 /100 | #43 | Exceptional 98.0% |
| Aleuts | 99.9 /100 | #44 | Exceptional 98.0% |
| Czechoslovakians | 99.9 /100 | #45 | Exceptional 98.0% |
| Arapaho | 99.9 /100 | #46 | Exceptional 98.0% |
| Native Hawaiians | 99.9 /100 | #47 | Exceptional 98.0% |
| Bulgarians | 99.8 /100 | #48 | Exceptional 98.0% |
| Estonians | 99.8 /100 | #49 | Exceptional 98.0% |