Immigrants from Jordan vs Hispanic or Latino 5th Grade
COMPARE
Immigrants from Jordan
Hispanic or Latino
5th Grade
5th Grade Comparison
Immigrants from Jordan
Hispanics or Latinos
97.4%
5TH GRADE
70.4/ 100
METRIC RATING
157th/ 347
METRIC RANK
95.6%
5TH GRADE
0.0/ 100
METRIC RATING
325th/ 347
METRIC RANK
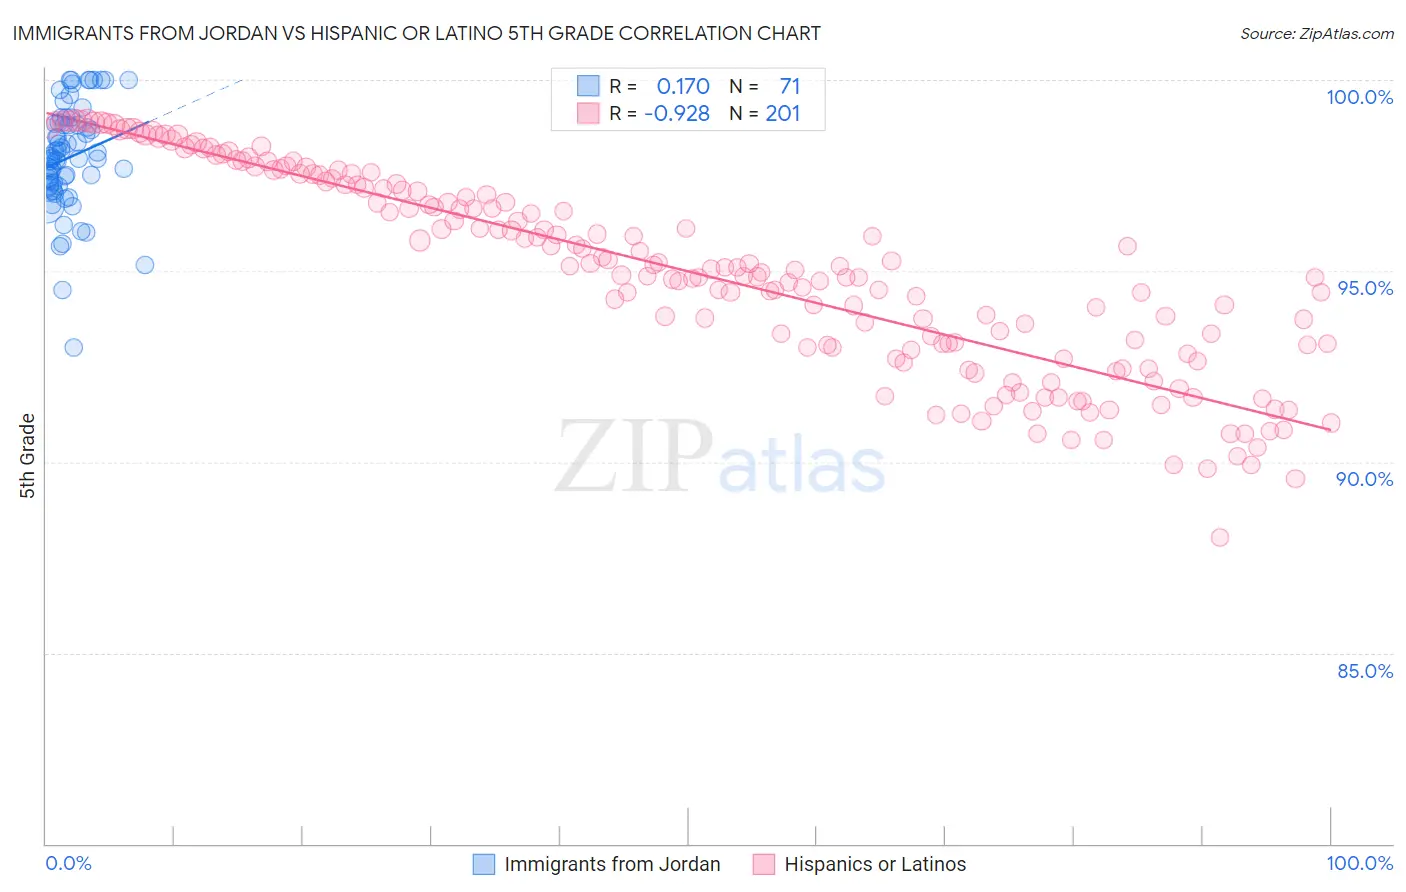
Immigrants from Jordan vs Hispanic or Latino 5th Grade Correlation Chart
The statistical analysis conducted on geographies consisting of 181,269,915 people shows a poor positive correlation between the proportion of Immigrants from Jordan and percentage of population with at least 5th grade education in the United States with a correlation coefficient (R) of 0.170 and weighted average of 97.4%. Similarly, the statistical analysis conducted on geographies consisting of 578,615,228 people shows a near-perfect negative correlation between the proportion of Hispanics or Latinos and percentage of population with at least 5th grade education in the United States with a correlation coefficient (R) of -0.928 and weighted average of 95.6%, a difference of 1.9%.
5th Grade Correlation Summary
| Measurement | Immigrants from Jordan | Hispanic or Latino |
| Minimum | 93.0% | 88.0% |
| Maximum | 100.0% | 99.0% |
| Range | 7.0% | 10.9% |
| Mean | 98.0% | 95.0% |
| Median | 98.0% | 95.0% |
| Interquartile 25% (IQ1) | 97.2% | 93.0% |
| Interquartile 75% (IQ3) | 98.8% | 97.3% |
| Interquartile Range (IQR) | 1.6% | 4.3% |
| Standard Deviation (Sample) | 1.4% | 2.6% |
| Standard Deviation (Population) | 1.4% | 2.6% |
Similar Demographics by 5th Grade
Demographics Similar to Immigrants from Jordan by 5th Grade
In terms of 5th grade, the demographic groups most similar to Immigrants from Jordan are Immigrants from Russia (97.4%, a difference of 0.0%), Immigrants from Bosnia and Herzegovina (97.4%, a difference of 0.0%), French American Indian (97.4%, a difference of 0.0%), Albanian (97.4%, a difference of 0.010%), and Immigrants from Eastern Europe (97.4%, a difference of 0.020%).
| Demographics | Rating | Rank | 5th Grade |
| Immigrants | South Central Asia | 78.6 /100 | #150 | Good 97.5% |
| Immigrants | Eastern Europe | 75.0 /100 | #151 | Good 97.4% |
| Ute | 74.9 /100 | #152 | Good 97.4% |
| Alsatians | 74.3 /100 | #153 | Good 97.4% |
| Immigrants | Russia | 71.2 /100 | #154 | Good 97.4% |
| Immigrants | Bosnia and Herzegovina | 71.0 /100 | #155 | Good 97.4% |
| French American Indians | 70.5 /100 | #156 | Good 97.4% |
| Immigrants | Jordan | 70.4 /100 | #157 | Good 97.4% |
| Albanians | 68.3 /100 | #158 | Good 97.4% |
| Immigrants | Italy | 65.2 /100 | #159 | Good 97.4% |
| Marshallese | 61.2 /100 | #160 | Good 97.4% |
| Kenyans | 59.7 /100 | #161 | Average 97.4% |
| Immigrants | Iran | 59.5 /100 | #162 | Average 97.4% |
| Ugandans | 58.9 /100 | #163 | Average 97.4% |
| Bermudans | 58.8 /100 | #164 | Average 97.4% |
Demographics Similar to Hispanics or Latinos by 5th Grade
In terms of 5th grade, the demographic groups most similar to Hispanics or Latinos are Honduran (95.6%, a difference of 0.0%), Immigrants from Fiji (95.6%, a difference of 0.020%), Immigrants from Cambodia (95.5%, a difference of 0.030%), Dominican (95.5%, a difference of 0.030%), and Cape Verdean (95.5%, a difference of 0.060%).
| Demographics | Rating | Rank | 5th Grade |
| Immigrants | Vietnam | 0.0 /100 | #318 | Tragic 95.8% |
| Japanese | 0.0 /100 | #319 | Tragic 95.7% |
| Central American Indians | 0.0 /100 | #320 | Tragic 95.7% |
| Immigrants | Belize | 0.0 /100 | #321 | Tragic 95.7% |
| Immigrants | Nicaragua | 0.0 /100 | #322 | Tragic 95.6% |
| Immigrants | Fiji | 0.0 /100 | #323 | Tragic 95.6% |
| Hondurans | 0.0 /100 | #324 | Tragic 95.6% |
| Hispanics or Latinos | 0.0 /100 | #325 | Tragic 95.6% |
| Immigrants | Cambodia | 0.0 /100 | #326 | Tragic 95.5% |
| Dominicans | 0.0 /100 | #327 | Tragic 95.5% |
| Cape Verdeans | 0.0 /100 | #328 | Tragic 95.5% |
| Mexican American Indians | 0.0 /100 | #329 | Tragic 95.5% |
| Immigrants | Armenia | 0.0 /100 | #330 | Tragic 95.4% |
| Immigrants | Honduras | 0.0 /100 | #331 | Tragic 95.4% |
| Immigrants | Dominican Republic | 0.0 /100 | #332 | Tragic 95.3% |