Immigrants from Iraq vs Immigrants 5th Grade
COMPARE
Immigrants from Iraq
Immigrants
5th Grade
5th Grade Comparison
Immigrants from Iraq
Immigrants
97.1%
5TH GRADE
8.3/ 100
METRIC RATING
212th/ 347
METRIC RANK
96.2%
5TH GRADE
0.0/ 100
METRIC RATING
299th/ 347
METRIC RANK
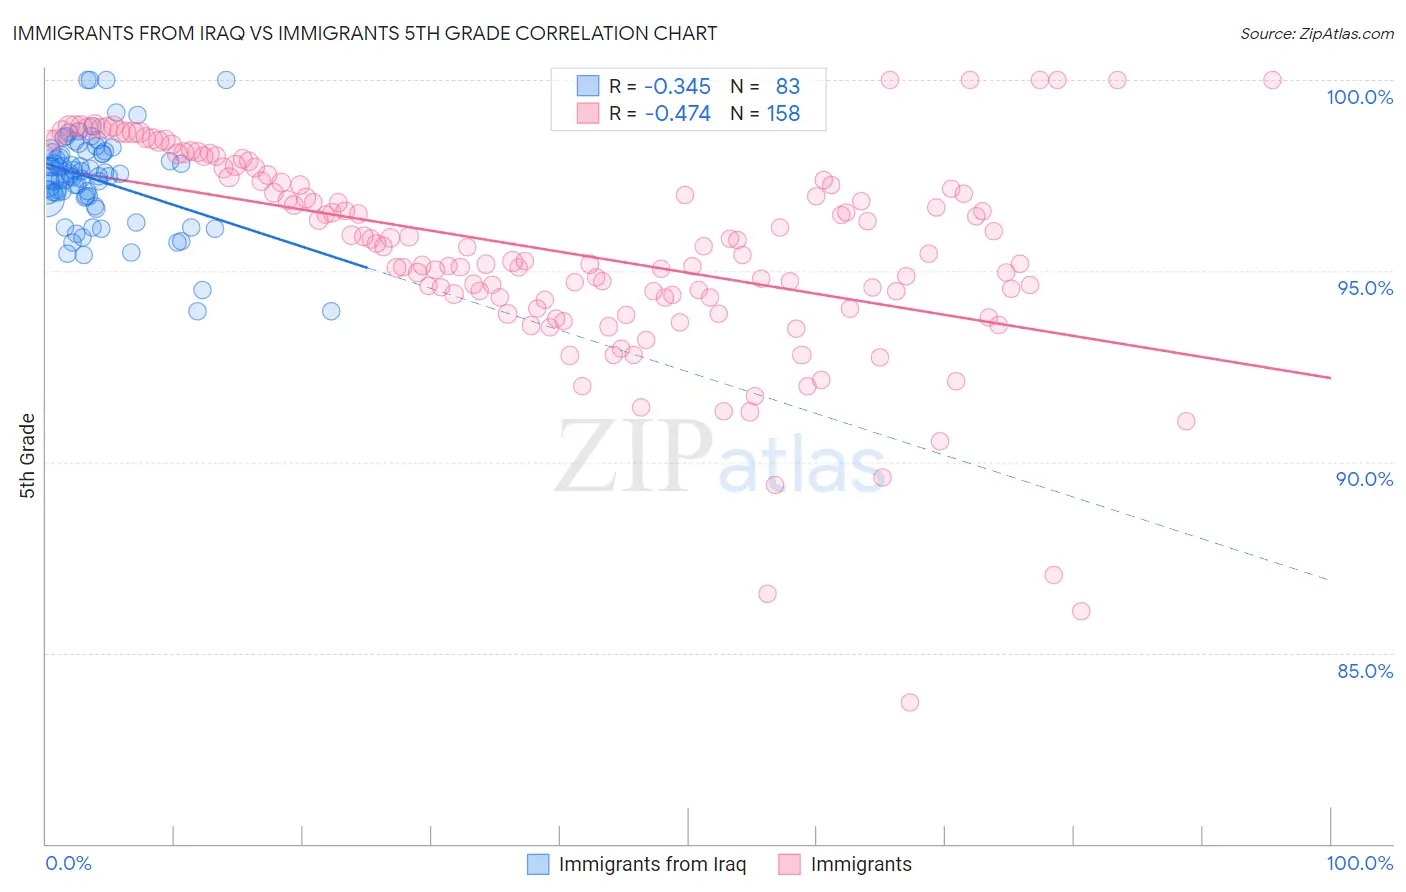
Immigrants from Iraq vs Immigrants 5th Grade Correlation Chart
The statistical analysis conducted on geographies consisting of 194,632,332 people shows a mild negative correlation between the proportion of Immigrants from Iraq and percentage of population with at least 5th grade education in the United States with a correlation coefficient (R) of -0.345 and weighted average of 97.1%. Similarly, the statistical analysis conducted on geographies consisting of 577,786,867 people shows a moderate negative correlation between the proportion of Immigrants and percentage of population with at least 5th grade education in the United States with a correlation coefficient (R) of -0.474 and weighted average of 96.2%, a difference of 0.95%.
5th Grade Correlation Summary
| Measurement | Immigrants from Iraq | Immigrants |
| Minimum | 93.9% | 83.7% |
| Maximum | 100.0% | 100.0% |
| Range | 6.1% | 16.3% |
| Mean | 97.4% | 95.5% |
| Median | 97.5% | 95.6% |
| Interquartile 25% (IQ1) | 96.9% | 94.3% |
| Interquartile 75% (IQ3) | 98.1% | 97.5% |
| Interquartile Range (IQR) | 1.2% | 3.2% |
| Standard Deviation (Sample) | 1.2% | 2.7% |
| Standard Deviation (Population) | 1.2% | 2.7% |
Similar Demographics by 5th Grade
Demographics Similar to Immigrants from Iraq by 5th Grade
In terms of 5th grade, the demographic groups most similar to Immigrants from Iraq are Samoan (97.1%, a difference of 0.0%), Portuguese (97.1%, a difference of 0.010%), Costa Rican (97.1%, a difference of 0.010%), Immigrants from Morocco (97.1%, a difference of 0.010%), and Immigrants from Nepal (97.1%, a difference of 0.020%).
| Demographics | Rating | Rank | 5th Grade |
| Moroccans | 12.0 /100 | #205 | Poor 97.1% |
| Paiute | 11.6 /100 | #206 | Poor 97.1% |
| Iraqis | 10.9 /100 | #207 | Poor 97.1% |
| Laotians | 10.8 /100 | #208 | Poor 97.1% |
| Immigrants | Nepal | 10.3 /100 | #209 | Poor 97.1% |
| Immigrants | Oceania | 10.0 /100 | #210 | Poor 97.1% |
| Samoans | 8.5 /100 | #211 | Tragic 97.1% |
| Immigrants | Iraq | 8.3 /100 | #212 | Tragic 97.1% |
| Portuguese | 7.8 /100 | #213 | Tragic 97.1% |
| Costa Ricans | 7.7 /100 | #214 | Tragic 97.1% |
| Immigrants | Morocco | 7.5 /100 | #215 | Tragic 97.1% |
| Sudanese | 7.0 /100 | #216 | Tragic 97.1% |
| Immigrants | Lebanon | 6.8 /100 | #217 | Tragic 97.1% |
| Immigrants | Sudan | 6.5 /100 | #218 | Tragic 97.1% |
| Immigrants | Syria | 6.4 /100 | #219 | Tragic 97.1% |
Demographics Similar to Immigrants by 5th Grade
In terms of 5th grade, the demographic groups most similar to Immigrants are Immigrants from Dominica (96.2%, a difference of 0.030%), Sri Lankan (96.1%, a difference of 0.050%), Immigrants from Cuba (96.1%, a difference of 0.070%), Haitian (96.3%, a difference of 0.080%), and Guyanese (96.1%, a difference of 0.080%).
| Demographics | Rating | Rank | 5th Grade |
| Somalis | 0.0 /100 | #292 | Tragic 96.5% |
| Immigrants | Grenada | 0.0 /100 | #293 | Tragic 96.5% |
| Immigrants | Eritrea | 0.0 /100 | #294 | Tragic 96.4% |
| Immigrants | Somalia | 0.0 /100 | #295 | Tragic 96.4% |
| Immigrants | South Eastern Asia | 0.0 /100 | #296 | Tragic 96.3% |
| Haitians | 0.0 /100 | #297 | Tragic 96.3% |
| Immigrants | Dominica | 0.0 /100 | #298 | Tragic 96.2% |
| Immigrants | Immigrants | 0.0 /100 | #299 | Tragic 96.2% |
| Sri Lankans | 0.0 /100 | #300 | Tragic 96.1% |
| Immigrants | Cuba | 0.0 /100 | #301 | Tragic 96.1% |
| Guyanese | 0.0 /100 | #302 | Tragic 96.1% |
| Puerto Ricans | 0.0 /100 | #303 | Tragic 96.1% |
| Immigrants | Burma/Myanmar | 0.0 /100 | #304 | Tragic 96.1% |
| Immigrants | Laos | 0.0 /100 | #305 | Tragic 96.0% |
| Immigrants | Haiti | 0.0 /100 | #306 | Tragic 96.0% |