Bermudan vs Immigrants 5th Grade
COMPARE
Bermudan
Immigrants
5th Grade
5th Grade Comparison
Bermudans
Immigrants
97.4%
5TH GRADE
58.8/ 100
METRIC RATING
164th/ 347
METRIC RANK
96.2%
5TH GRADE
0.0/ 100
METRIC RATING
299th/ 347
METRIC RANK
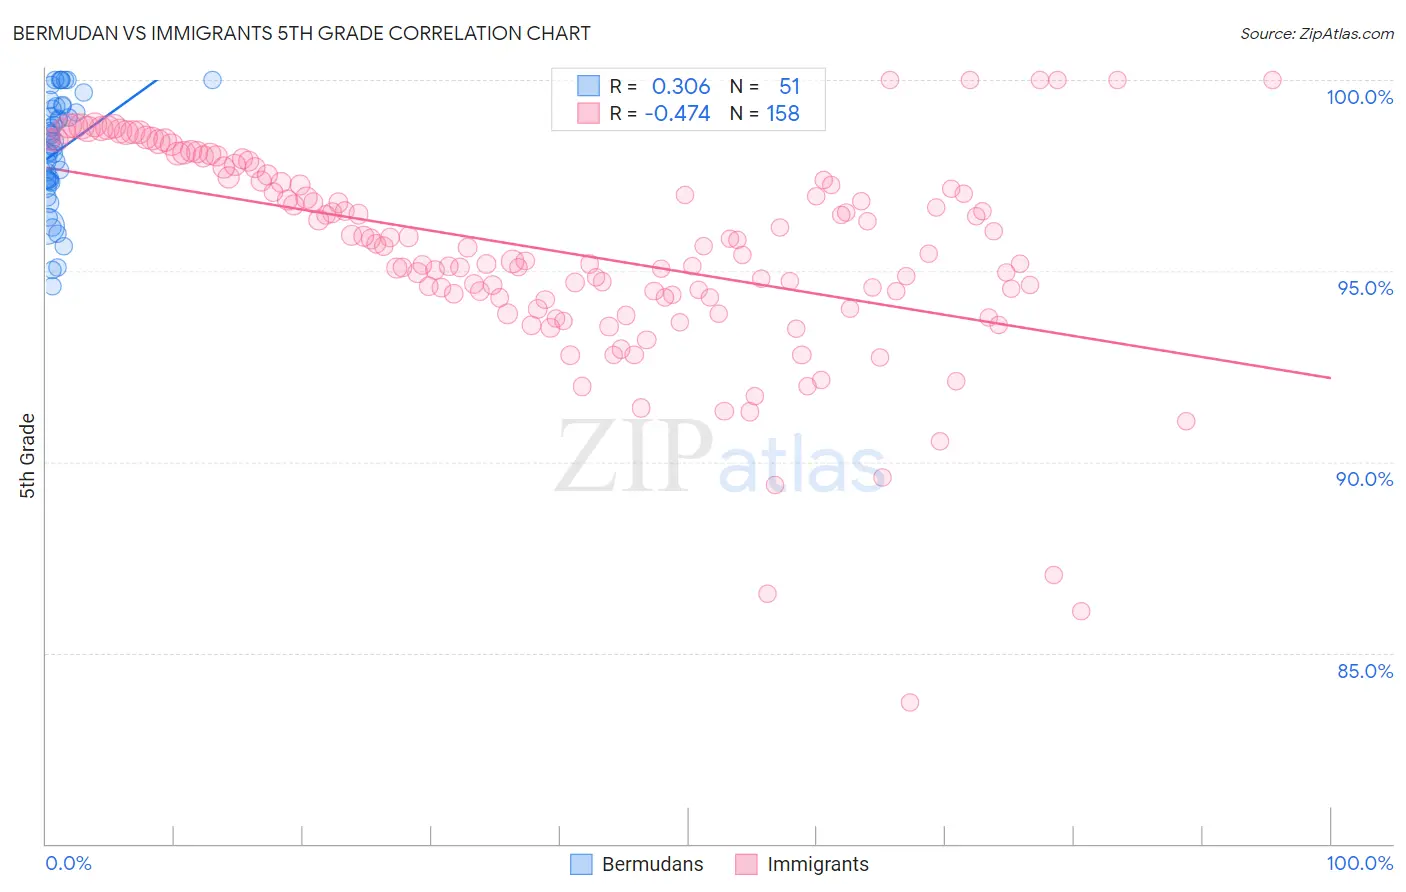
Bermudan vs Immigrants 5th Grade Correlation Chart
The statistical analysis conducted on geographies consisting of 55,721,975 people shows a mild positive correlation between the proportion of Bermudans and percentage of population with at least 5th grade education in the United States with a correlation coefficient (R) of 0.306 and weighted average of 97.4%. Similarly, the statistical analysis conducted on geographies consisting of 577,786,867 people shows a moderate negative correlation between the proportion of Immigrants and percentage of population with at least 5th grade education in the United States with a correlation coefficient (R) of -0.474 and weighted average of 96.2%, a difference of 1.2%.
5th Grade Correlation Summary
| Measurement | Bermudan | Immigrants |
| Minimum | 94.6% | 83.7% |
| Maximum | 100.0% | 100.0% |
| Range | 5.4% | 16.3% |
| Mean | 98.1% | 95.5% |
| Median | 98.4% | 95.6% |
| Interquartile 25% (IQ1) | 97.3% | 94.3% |
| Interquartile 75% (IQ3) | 99.3% | 97.5% |
| Interquartile Range (IQR) | 2.0% | 3.2% |
| Standard Deviation (Sample) | 1.4% | 2.7% |
| Standard Deviation (Population) | 1.4% | 2.7% |
Similar Demographics by 5th Grade
Demographics Similar to Bermudans by 5th Grade
In terms of 5th grade, the demographic groups most similar to Bermudans are Kenyan (97.4%, a difference of 0.0%), Immigrants from Iran (97.4%, a difference of 0.0%), Ugandan (97.4%, a difference of 0.0%), Immigrants from Poland (97.4%, a difference of 0.0%), and Marshallese (97.4%, a difference of 0.010%).
| Demographics | Rating | Rank | 5th Grade |
| Immigrants | Jordan | 70.4 /100 | #157 | Good 97.4% |
| Albanians | 68.3 /100 | #158 | Good 97.4% |
| Immigrants | Italy | 65.2 /100 | #159 | Good 97.4% |
| Marshallese | 61.2 /100 | #160 | Good 97.4% |
| Kenyans | 59.7 /100 | #161 | Average 97.4% |
| Immigrants | Iran | 59.5 /100 | #162 | Average 97.4% |
| Ugandans | 58.9 /100 | #163 | Average 97.4% |
| Bermudans | 58.8 /100 | #164 | Average 97.4% |
| Immigrants | Poland | 57.9 /100 | #165 | Average 97.4% |
| Apache | 57.2 /100 | #166 | Average 97.4% |
| Immigrants | Belarus | 54.6 /100 | #167 | Average 97.3% |
| Chileans | 54.5 /100 | #168 | Average 97.3% |
| Immigrants | Korea | 54.1 /100 | #169 | Average 97.3% |
| Venezuelans | 54.0 /100 | #170 | Average 97.3% |
| Immigrants | Sri Lanka | 53.8 /100 | #171 | Average 97.3% |
Demographics Similar to Immigrants by 5th Grade
In terms of 5th grade, the demographic groups most similar to Immigrants are Immigrants from Dominica (96.2%, a difference of 0.030%), Sri Lankan (96.1%, a difference of 0.050%), Immigrants from Cuba (96.1%, a difference of 0.070%), Haitian (96.3%, a difference of 0.080%), and Guyanese (96.1%, a difference of 0.080%).
| Demographics | Rating | Rank | 5th Grade |
| Somalis | 0.0 /100 | #292 | Tragic 96.5% |
| Immigrants | Grenada | 0.0 /100 | #293 | Tragic 96.5% |
| Immigrants | Eritrea | 0.0 /100 | #294 | Tragic 96.4% |
| Immigrants | Somalia | 0.0 /100 | #295 | Tragic 96.4% |
| Immigrants | South Eastern Asia | 0.0 /100 | #296 | Tragic 96.3% |
| Haitians | 0.0 /100 | #297 | Tragic 96.3% |
| Immigrants | Dominica | 0.0 /100 | #298 | Tragic 96.2% |
| Immigrants | Immigrants | 0.0 /100 | #299 | Tragic 96.2% |
| Sri Lankans | 0.0 /100 | #300 | Tragic 96.1% |
| Immigrants | Cuba | 0.0 /100 | #301 | Tragic 96.1% |
| Guyanese | 0.0 /100 | #302 | Tragic 96.1% |
| Puerto Ricans | 0.0 /100 | #303 | Tragic 96.1% |
| Immigrants | Burma/Myanmar | 0.0 /100 | #304 | Tragic 96.1% |
| Immigrants | Laos | 0.0 /100 | #305 | Tragic 96.0% |
| Immigrants | Haiti | 0.0 /100 | #306 | Tragic 96.0% |