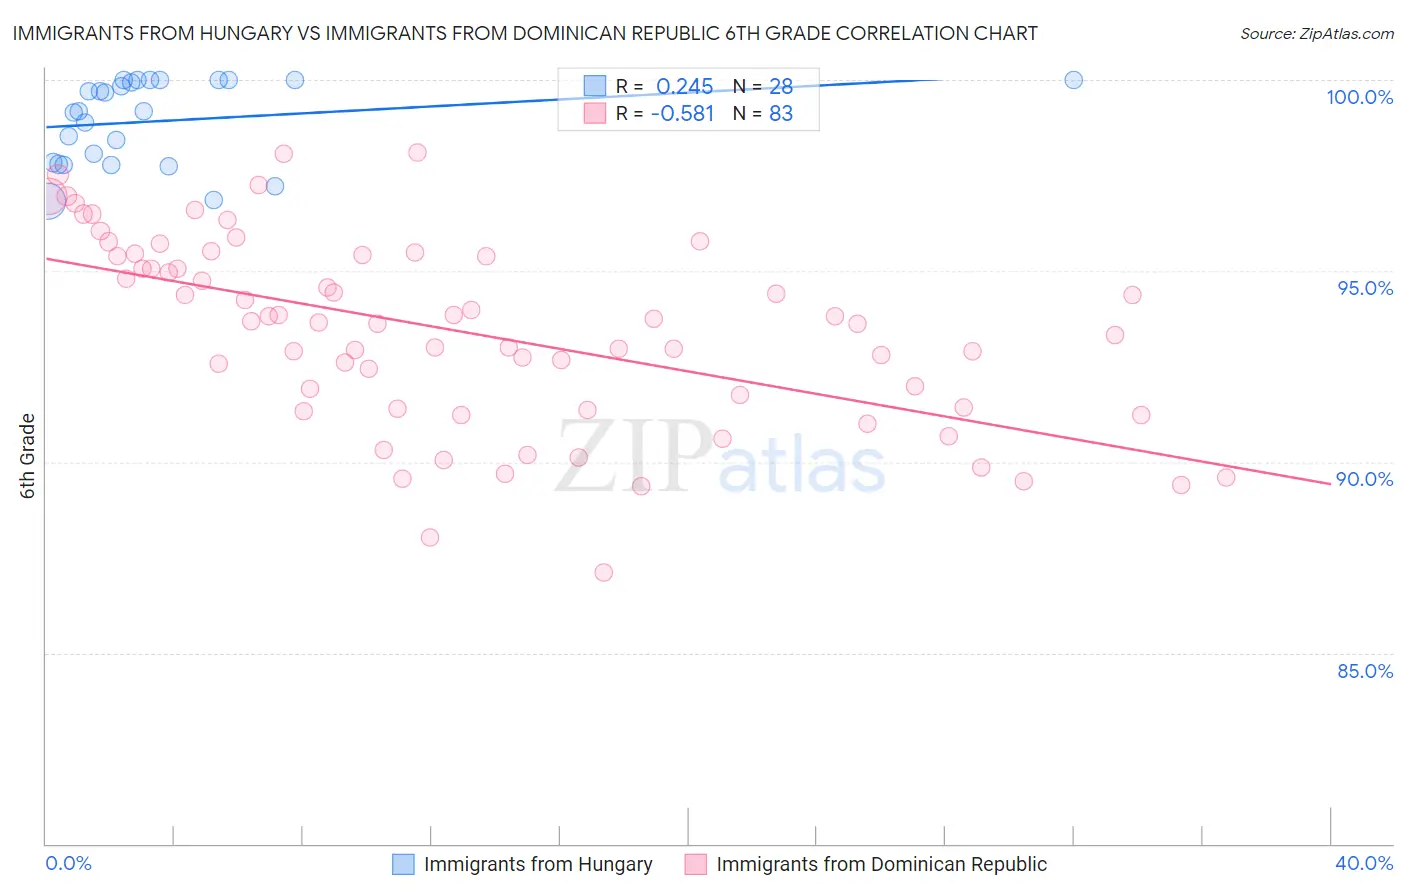
Immigrants from Hungary vs Immigrants from Dominican Republic 6th Grade
COMPARE
Immigrants from Hungary
Immigrants from Dominican Republic
6th Grade
6th Grade Comparison
Immigrants from Hungary
Immigrants from Dominican Republic
97.3%
6TH GRADE
89.5/ 100
METRIC RATING
135th/ 347
METRIC RANK
94.6%
6TH GRADE
0.0/ 100
METRIC RATING
336th/ 347
METRIC RANK
Immigrants from Hungary vs Immigrants from Dominican Republic 6th Grade Correlation Chart
The statistical analysis conducted on geographies consisting of 195,707,305 people shows a weak positive correlation between the proportion of Immigrants from Hungary and percentage of population with at least 6th grade education in the United States with a correlation coefficient (R) of 0.245 and weighted average of 97.3%. Similarly, the statistical analysis conducted on geographies consisting of 275,144,349 people shows a substantial negative correlation between the proportion of Immigrants from Dominican Republic and percentage of population with at least 6th grade education in the United States with a correlation coefficient (R) of -0.581 and weighted average of 94.6%, a difference of 2.8%.
6th Grade Correlation Summary
| Measurement | Immigrants from Hungary | Immigrants from Dominican Republic |
| Minimum | 96.8% | 87.1% |
| Maximum | 100.0% | 98.1% |
| Range | 3.2% | 11.0% |
| Mean | 98.9% | 93.4% |
| Median | 99.2% | 93.6% |
| Interquartile 25% (IQ1) | 97.8% | 91.4% |
| Interquartile 75% (IQ3) | 100.0% | 95.4% |
| Interquartile Range (IQR) | 2.2% | 4.0% |
| Standard Deviation (Sample) | 1.1% | 2.5% |
| Standard Deviation (Population) | 1.1% | 2.5% |
Similar Demographics by 6th Grade
Demographics Similar to Immigrants from Hungary by 6th Grade
In terms of 6th grade, the demographic groups most similar to Immigrants from Hungary are Immigrants from Kuwait (97.3%, a difference of 0.0%), Immigrants from Moldova (97.3%, a difference of 0.010%), Filipino (97.3%, a difference of 0.010%), Immigrants from Europe (97.3%, a difference of 0.020%), and Palestinian (97.3%, a difference of 0.020%).
| Demographics | Rating | Rank | 6th Grade |
| Immigrants | Romania | 92.0 /100 | #128 | Exceptional 97.3% |
| Immigrants | Serbia | 91.9 /100 | #129 | Exceptional 97.3% |
| Cambodians | 91.8 /100 | #130 | Exceptional 97.3% |
| Immigrants | Europe | 91.1 /100 | #131 | Exceptional 97.3% |
| Palestinians | 90.9 /100 | #132 | Exceptional 97.3% |
| Immigrants | Moldova | 90.0 /100 | #133 | Excellent 97.3% |
| Immigrants | Kuwait | 89.5 /100 | #134 | Excellent 97.3% |
| Immigrants | Hungary | 89.5 /100 | #135 | Excellent 97.3% |
| Filipinos | 88.9 /100 | #136 | Excellent 97.3% |
| Burmese | 87.8 /100 | #137 | Excellent 97.3% |
| Blackfeet | 87.7 /100 | #138 | Excellent 97.3% |
| Immigrants | Turkey | 86.1 /100 | #139 | Excellent 97.3% |
| Immigrants | North Macedonia | 85.5 /100 | #140 | Excellent 97.2% |
| Seminole | 84.8 /100 | #141 | Excellent 97.2% |
| Jordanians | 84.6 /100 | #142 | Excellent 97.2% |
Demographics Similar to Immigrants from Dominican Republic by 6th Grade
In terms of 6th grade, the demographic groups most similar to Immigrants from Dominican Republic are Mexican (94.6%, a difference of 0.020%), Immigrants from the Azores (94.7%, a difference of 0.040%), Immigrants from Latin America (94.7%, a difference of 0.060%), Immigrants from Honduras (94.8%, a difference of 0.14%), and Central American (94.5%, a difference of 0.18%).
| Demographics | Rating | Rank | 6th Grade |
| Dominicans | 0.0 /100 | #329 | Tragic 94.9% |
| Nepalese | 0.0 /100 | #330 | Tragic 94.9% |
| Immigrants | Armenia | 0.0 /100 | #331 | Tragic 94.9% |
| Immigrants | Honduras | 0.0 /100 | #332 | Tragic 94.8% |
| Immigrants | Latin America | 0.0 /100 | #333 | Tragic 94.7% |
| Immigrants | Azores | 0.0 /100 | #334 | Tragic 94.7% |
| Mexicans | 0.0 /100 | #335 | Tragic 94.6% |
| Immigrants | Dominican Republic | 0.0 /100 | #336 | Tragic 94.6% |
| Central Americans | 0.0 /100 | #337 | Tragic 94.5% |
| Immigrants | Cabo Verde | 0.0 /100 | #338 | Tragic 94.4% |
| Yakama | 0.0 /100 | #339 | Tragic 94.3% |
| Guatemalans | 0.0 /100 | #340 | Tragic 94.2% |
| Immigrants | Yemen | 0.0 /100 | #341 | Tragic 94.1% |
| Immigrants | Central America | 0.0 /100 | #342 | Tragic 94.0% |
| Immigrants | Mexico | 0.0 /100 | #343 | Tragic 93.9% |