Immigrants from Hong Kong vs Greek 7th Grade
COMPARE
Immigrants from Hong Kong
Greek
7th Grade
7th Grade Comparison
Immigrants from Hong Kong
Greeks
95.2%
7TH GRADE
0.3/ 100
METRIC RATING
268th/ 347
METRIC RANK
97.0%
7TH GRADE
99.9/ 100
METRIC RATING
52nd/ 347
METRIC RANK
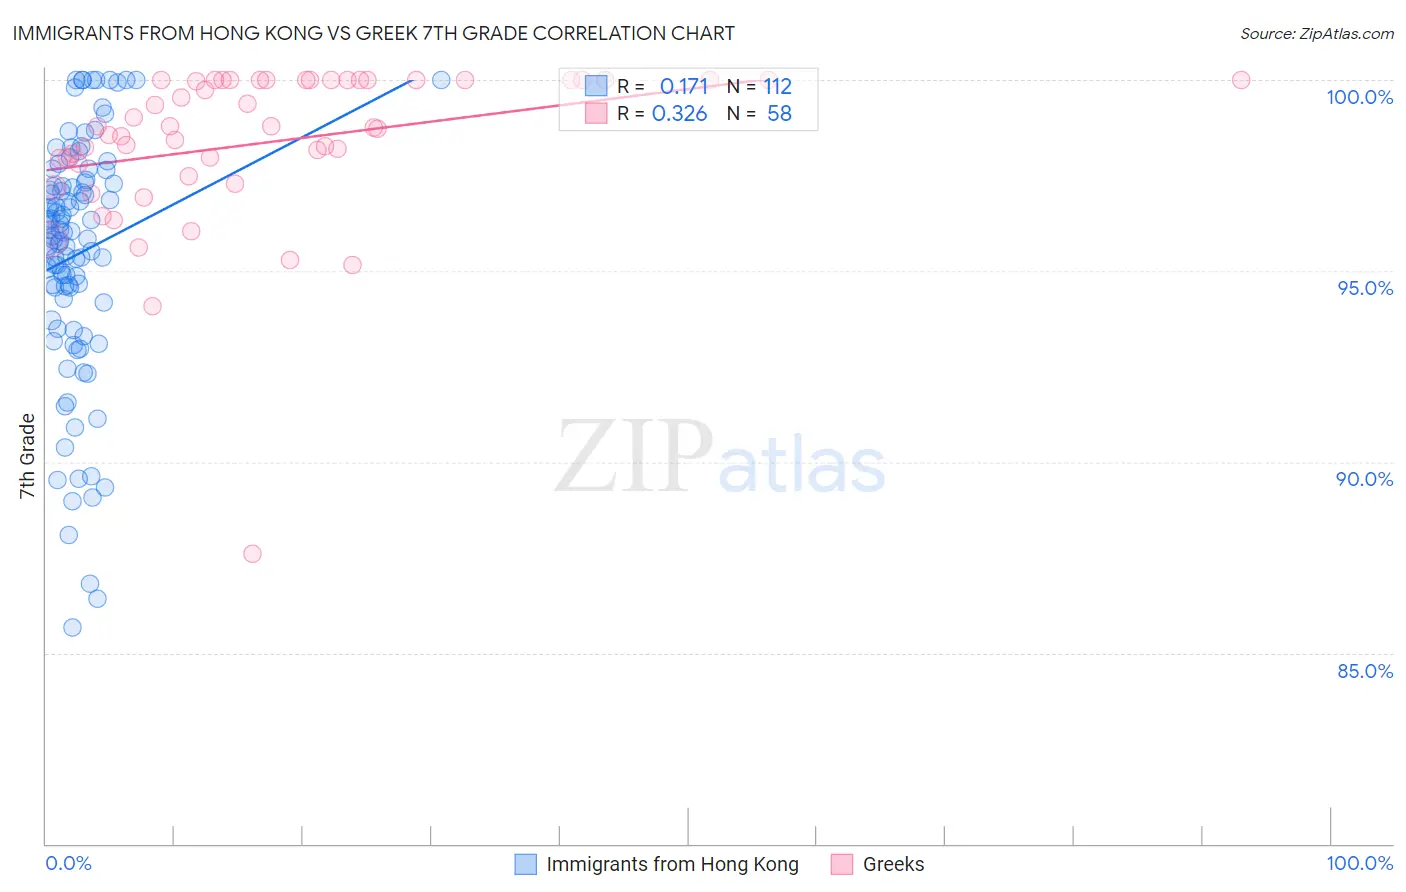
Immigrants from Hong Kong vs Greek 7th Grade Correlation Chart
The statistical analysis conducted on geographies consisting of 253,949,931 people shows a poor positive correlation between the proportion of Immigrants from Hong Kong and percentage of population with at least 7th grade education in the United States with a correlation coefficient (R) of 0.171 and weighted average of 95.2%. Similarly, the statistical analysis conducted on geographies consisting of 482,775,358 people shows a mild positive correlation between the proportion of Greeks and percentage of population with at least 7th grade education in the United States with a correlation coefficient (R) of 0.326 and weighted average of 97.0%, a difference of 1.9%.
7th Grade Correlation Summary
| Measurement | Immigrants from Hong Kong | Greek |
| Minimum | 85.7% | 87.6% |
| Maximum | 100.0% | 100.0% |
| Range | 14.3% | 12.4% |
| Mean | 95.4% | 98.4% |
| Median | 95.9% | 98.8% |
| Interquartile 25% (IQ1) | 94.2% | 97.8% |
| Interquartile 75% (IQ3) | 97.3% | 100.0% |
| Interquartile Range (IQR) | 3.1% | 2.2% |
| Standard Deviation (Sample) | 3.2% | 2.1% |
| Standard Deviation (Population) | 3.1% | 2.1% |
Similar Demographics by 7th Grade
Demographics Similar to Immigrants from Hong Kong by 7th Grade
In terms of 7th grade, the demographic groups most similar to Immigrants from Hong Kong are Yuman (95.2%, a difference of 0.010%), Immigrants from Uruguay (95.2%, a difference of 0.020%), Immigrants from Ghana (95.2%, a difference of 0.020%), Trinidadian and Tobagonian (95.2%, a difference of 0.020%), and Houma (95.1%, a difference of 0.040%).
| Demographics | Rating | Rank | 7th Grade |
| South Americans | 0.5 /100 | #261 | Tragic 95.2% |
| Immigrants | Somalia | 0.5 /100 | #262 | Tragic 95.2% |
| West Indians | 0.5 /100 | #263 | Tragic 95.2% |
| Immigrants | Nigeria | 0.4 /100 | #264 | Tragic 95.2% |
| Immigrants | Uruguay | 0.3 /100 | #265 | Tragic 95.2% |
| Immigrants | Ghana | 0.3 /100 | #266 | Tragic 95.2% |
| Yuman | 0.3 /100 | #267 | Tragic 95.2% |
| Immigrants | Hong Kong | 0.3 /100 | #268 | Tragic 95.2% |
| Trinidadians and Tobagonians | 0.3 /100 | #269 | Tragic 95.2% |
| Houma | 0.2 /100 | #270 | Tragic 95.1% |
| Immigrants | South America | 0.2 /100 | #271 | Tragic 95.1% |
| Peruvians | 0.2 /100 | #272 | Tragic 95.1% |
| Immigrants | Uzbekistan | 0.2 /100 | #273 | Tragic 95.1% |
| Immigrants | Western Africa | 0.2 /100 | #274 | Tragic 95.1% |
| Immigrants | Colombia | 0.2 /100 | #275 | Tragic 95.1% |
Demographics Similar to Greeks by 7th Grade
In terms of 7th grade, the demographic groups most similar to Greeks are Austrian (97.0%, a difference of 0.010%), Estonian (97.0%, a difference of 0.020%), Australian (97.0%, a difference of 0.030%), Russian (97.0%, a difference of 0.040%), and Serbian (97.0%, a difference of 0.040%).
| Demographics | Rating | Rank | 7th Grade |
| Czechoslovakians | 99.9 /100 | #45 | Exceptional 97.1% |
| Aleuts | 99.9 /100 | #46 | Exceptional 97.1% |
| Bulgarians | 99.9 /100 | #47 | Exceptional 97.1% |
| Celtics | 99.9 /100 | #48 | Exceptional 97.1% |
| Slavs | 99.9 /100 | #49 | Exceptional 97.1% |
| Immigrants | Scotland | 99.9 /100 | #50 | Exceptional 97.1% |
| Estonians | 99.9 /100 | #51 | Exceptional 97.0% |
| Greeks | 99.9 /100 | #52 | Exceptional 97.0% |
| Austrians | 99.8 /100 | #53 | Exceptional 97.0% |
| Australians | 99.8 /100 | #54 | Exceptional 97.0% |
| Russians | 99.8 /100 | #55 | Exceptional 97.0% |
| Serbians | 99.8 /100 | #56 | Exceptional 97.0% |
| Americans | 99.8 /100 | #57 | Exceptional 97.0% |
| Whites/Caucasians | 99.8 /100 | #58 | Exceptional 97.0% |
| Macedonians | 99.8 /100 | #59 | Exceptional 97.0% |