Immigrants from Honduras vs African Nursery School
COMPARE
Immigrants from Honduras
African
Nursery School
Nursery School Comparison
Immigrants from Honduras
Africans
96.9%
NURSERY SCHOOL
0.0/ 100
METRIC RATING
323rd/ 347
METRIC RANK
97.9%
NURSERY SCHOOL
15.4/ 100
METRIC RATING
207th/ 347
METRIC RANK
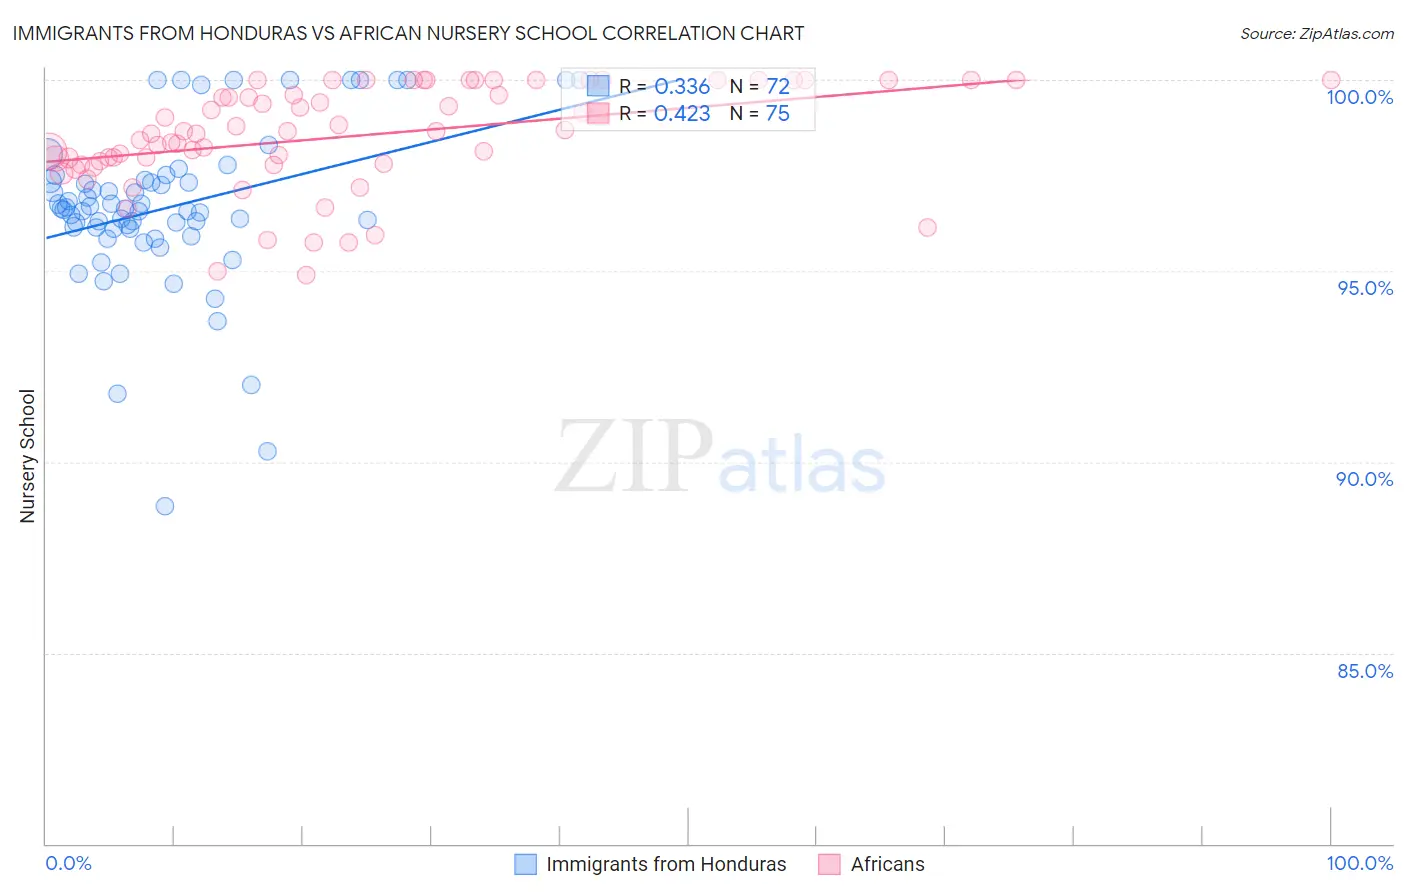
Immigrants from Honduras vs African Nursery School Correlation Chart
The statistical analysis conducted on geographies consisting of 322,637,445 people shows a mild positive correlation between the proportion of Immigrants from Honduras and percentage of population with at least nursery school education in the United States with a correlation coefficient (R) of 0.336 and weighted average of 96.9%. Similarly, the statistical analysis conducted on geographies consisting of 470,094,148 people shows a moderate positive correlation between the proportion of Africans and percentage of population with at least nursery school education in the United States with a correlation coefficient (R) of 0.423 and weighted average of 97.9%, a difference of 1.0%.
Nursery School Correlation Summary
| Measurement | Immigrants from Honduras | African |
| Minimum | 88.8% | 94.9% |
| Maximum | 100.0% | 100.0% |
| Range | 11.2% | 5.1% |
| Mean | 96.7% | 98.5% |
| Median | 96.6% | 98.6% |
| Interquartile 25% (IQ1) | 96.1% | 97.8% |
| Interquartile 75% (IQ3) | 97.4% | 100.0% |
| Interquartile Range (IQR) | 1.3% | 2.2% |
| Standard Deviation (Sample) | 2.1% | 1.3% |
| Standard Deviation (Population) | 2.1% | 1.3% |
Similar Demographics by Nursery School
Demographics Similar to Immigrants from Honduras by Nursery School
In terms of nursery school, the demographic groups most similar to Immigrants from Honduras are Mexican American Indian (96.9%, a difference of 0.0%), Vietnamese (96.8%, a difference of 0.010%), Immigrants from Bangladesh (96.9%, a difference of 0.020%), Immigrants from Laos (96.9%, a difference of 0.030%), and Immigrants from Burma/Myanmar (96.9%, a difference of 0.030%).
| Demographics | Rating | Rank | Nursery School |
| Immigrants | Belize | 0.0 /100 | #316 | Tragic 96.9% |
| Immigrants | Ecuador | 0.0 /100 | #317 | Tragic 96.9% |
| Immigrants | Guyana | 0.0 /100 | #318 | Tragic 96.9% |
| Immigrants | Laos | 0.0 /100 | #319 | Tragic 96.9% |
| Immigrants | Burma/Myanmar | 0.0 /100 | #320 | Tragic 96.9% |
| Immigrants | Bangladesh | 0.0 /100 | #321 | Tragic 96.9% |
| Mexican American Indians | 0.0 /100 | #322 | Tragic 96.9% |
| Immigrants | Honduras | 0.0 /100 | #323 | Tragic 96.9% |
| Vietnamese | 0.0 /100 | #324 | Tragic 96.8% |
| Dominicans | 0.0 /100 | #325 | Tragic 96.8% |
| Indonesians | 0.0 /100 | #326 | Tragic 96.8% |
| Mexicans | 0.0 /100 | #327 | Tragic 96.8% |
| Immigrants | Latin America | 0.0 /100 | #328 | Tragic 96.7% |
| Immigrants | Vietnam | 0.0 /100 | #329 | Tragic 96.7% |
| Japanese | 0.0 /100 | #330 | Tragic 96.7% |
Demographics Similar to Africans by Nursery School
In terms of nursery school, the demographic groups most similar to Africans are Immigrants from Uganda (97.9%, a difference of 0.010%), Immigrants from Southern Europe (97.9%, a difference of 0.010%), Immigrants from Chile (97.9%, a difference of 0.010%), Immigrants from Albania (97.9%, a difference of 0.010%), and Immigrants from Ukraine (97.9%, a difference of 0.020%).
| Demographics | Rating | Rank | Nursery School |
| Tohono O'odham | 22.2 /100 | #200 | Fair 97.9% |
| Immigrants | Lebanon | 21.2 /100 | #201 | Fair 97.9% |
| Immigrants | Ukraine | 19.9 /100 | #202 | Poor 97.9% |
| Immigrants | Uganda | 18.0 /100 | #203 | Poor 97.9% |
| Immigrants | Southern Europe | 17.4 /100 | #204 | Poor 97.9% |
| Immigrants | Chile | 17.3 /100 | #205 | Poor 97.9% |
| Immigrants | Albania | 16.4 /100 | #206 | Poor 97.9% |
| Africans | 15.4 /100 | #207 | Poor 97.9% |
| Immigrants | Northern Africa | 11.7 /100 | #208 | Poor 97.8% |
| Costa Ricans | 11.3 /100 | #209 | Poor 97.8% |
| Immigrants | Oceania | 10.2 /100 | #210 | Poor 97.8% |
| Laotians | 9.8 /100 | #211 | Tragic 97.8% |
| Immigrants | Bahamas | 8.6 /100 | #212 | Tragic 97.8% |
| Moroccans | 8.3 /100 | #213 | Tragic 97.8% |
| South American Indians | 8.0 /100 | #214 | Tragic 97.8% |