Immigrants from Guyana vs Romanian 5th Grade
COMPARE
Immigrants from Guyana
Romanian
5th Grade
5th Grade Comparison
Immigrants from Guyana
Romanians
96.0%
5TH GRADE
0.0/ 100
METRIC RATING
309th/ 347
METRIC RANK
97.8%
5TH GRADE
98.6/ 100
METRIC RATING
95th/ 347
METRIC RANK
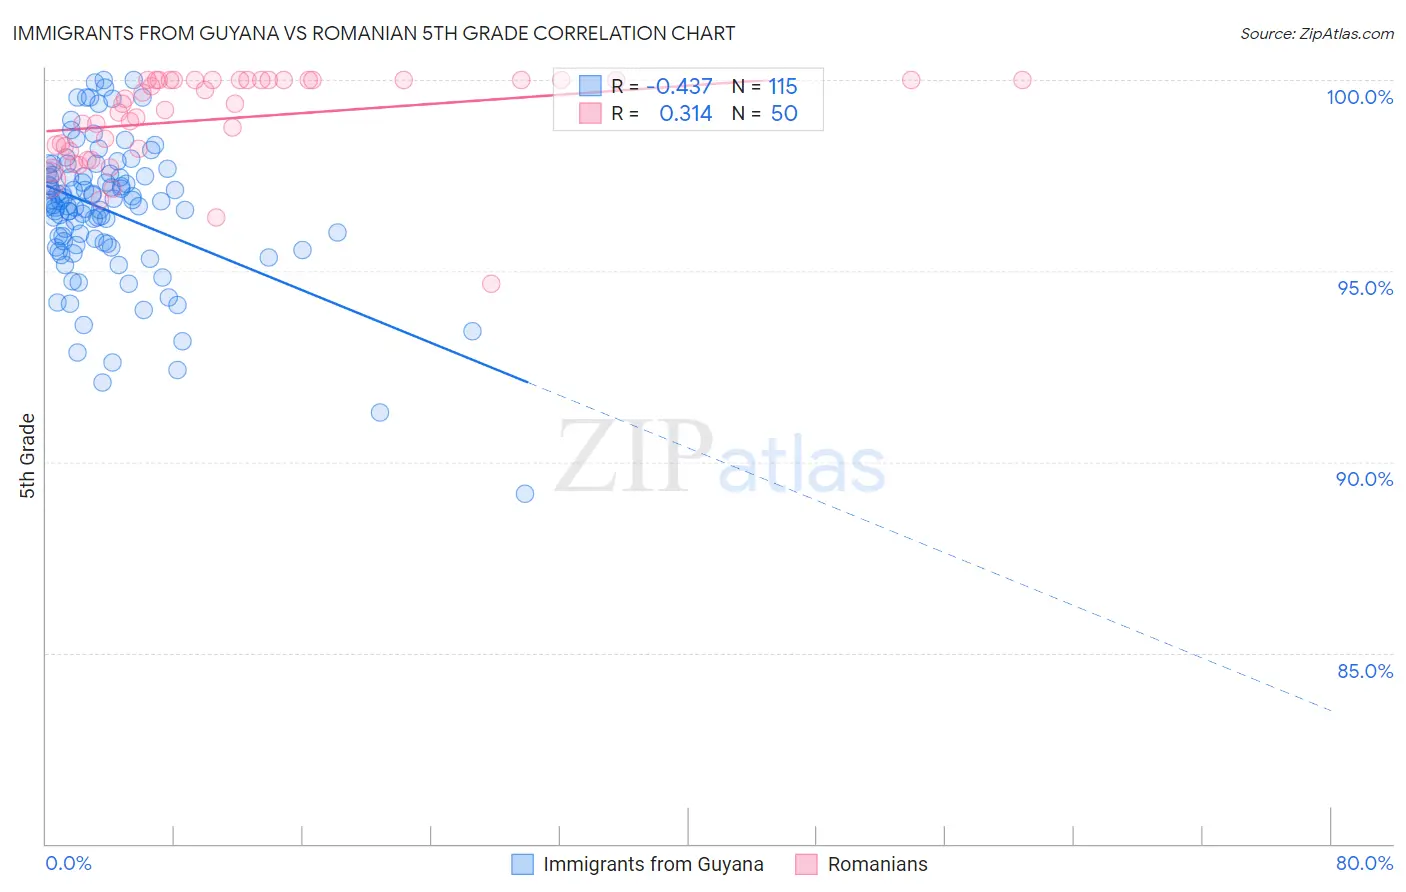
Immigrants from Guyana vs Romanian 5th Grade Correlation Chart
The statistical analysis conducted on geographies consisting of 183,673,461 people shows a moderate negative correlation between the proportion of Immigrants from Guyana and percentage of population with at least 5th grade education in the United States with a correlation coefficient (R) of -0.437 and weighted average of 96.0%. Similarly, the statistical analysis conducted on geographies consisting of 377,904,438 people shows a mild positive correlation between the proportion of Romanians and percentage of population with at least 5th grade education in the United States with a correlation coefficient (R) of 0.314 and weighted average of 97.8%, a difference of 1.8%.
5th Grade Correlation Summary
| Measurement | Immigrants from Guyana | Romanian |
| Minimum | 89.2% | 94.7% |
| Maximum | 100.0% | 100.0% |
| Range | 10.8% | 5.3% |
| Mean | 96.6% | 99.0% |
| Median | 96.7% | 99.4% |
| Interquartile 25% (IQ1) | 95.7% | 98.2% |
| Interquartile 75% (IQ3) | 97.5% | 100.0% |
| Interquartile Range (IQR) | 1.9% | 1.8% |
| Standard Deviation (Sample) | 1.9% | 1.2% |
| Standard Deviation (Population) | 1.9% | 1.2% |
Similar Demographics by 5th Grade
Demographics Similar to Immigrants from Guyana by 5th Grade
In terms of 5th grade, the demographic groups most similar to Immigrants from Guyana are Ecuadorian (96.0%, a difference of 0.010%), Immigrants from Haiti (96.0%, a difference of 0.020%), Immigrants from Caribbean (96.0%, a difference of 0.020%), Immigrants from Laos (96.0%, a difference of 0.030%), and Indonesian (96.0%, a difference of 0.040%).
| Demographics | Rating | Rank | 5th Grade |
| Guyanese | 0.0 /100 | #302 | Tragic 96.1% |
| Puerto Ricans | 0.0 /100 | #303 | Tragic 96.1% |
| Immigrants | Burma/Myanmar | 0.0 /100 | #304 | Tragic 96.1% |
| Immigrants | Laos | 0.0 /100 | #305 | Tragic 96.0% |
| Immigrants | Haiti | 0.0 /100 | #306 | Tragic 96.0% |
| Immigrants | Caribbean | 0.0 /100 | #307 | Tragic 96.0% |
| Ecuadorians | 0.0 /100 | #308 | Tragic 96.0% |
| Immigrants | Guyana | 0.0 /100 | #309 | Tragic 96.0% |
| Indonesians | 0.0 /100 | #310 | Tragic 96.0% |
| Immigrants | Bangladesh | 0.0 /100 | #311 | Tragic 96.0% |
| Vietnamese | 0.0 /100 | #312 | Tragic 95.9% |
| Bangladeshis | 0.0 /100 | #313 | Tragic 95.9% |
| Immigrants | Portugal | 0.0 /100 | #314 | Tragic 95.9% |
| Nicaraguans | 0.0 /100 | #315 | Tragic 95.9% |
| Immigrants | Ecuador | 0.0 /100 | #316 | Tragic 95.8% |
Demographics Similar to Romanians by 5th Grade
In terms of 5th grade, the demographic groups most similar to Romanians are Immigrants from Denmark (97.8%, a difference of 0.0%), Immigrants from Germany (97.8%, a difference of 0.0%), Immigrants from Sweden (97.8%, a difference of 0.010%), Delaware (97.8%, a difference of 0.010%), and Cree (97.7%, a difference of 0.010%).
| Demographics | Rating | Rank | 5th Grade |
| Shoshone | 98.8 /100 | #88 | Exceptional 97.8% |
| Immigrants | South Africa | 98.8 /100 | #89 | Exceptional 97.8% |
| Immigrants | Ireland | 98.8 /100 | #90 | Exceptional 97.8% |
| Immigrants | Western Europe | 98.8 /100 | #91 | Exceptional 97.8% |
| Immigrants | Sweden | 98.7 /100 | #92 | Exceptional 97.8% |
| Delaware | 98.6 /100 | #93 | Exceptional 97.8% |
| Immigrants | Denmark | 98.6 /100 | #94 | Exceptional 97.8% |
| Romanians | 98.6 /100 | #95 | Exceptional 97.8% |
| Immigrants | Germany | 98.5 /100 | #96 | Exceptional 97.8% |
| Cree | 98.4 /100 | #97 | Exceptional 97.7% |
| Yugoslavians | 98.3 /100 | #98 | Exceptional 97.7% |
| Turks | 98.3 /100 | #99 | Exceptional 97.7% |
| Puget Sound Salish | 98.3 /100 | #100 | Exceptional 97.7% |
| South Africans | 98.3 /100 | #101 | Exceptional 97.7% |
| Choctaw | 98.0 /100 | #102 | Exceptional 97.7% |