Immigrants from Fiji vs Afghan 10th Grade
COMPARE
Immigrants from Fiji
Afghan
10th Grade
10th Grade Comparison
Immigrants from Fiji
Afghans
91.0%
10TH GRADE
0.0/ 100
METRIC RATING
307th/ 347
METRIC RANK
93.1%
10TH GRADE
4.5/ 100
METRIC RATING
236th/ 347
METRIC RANK
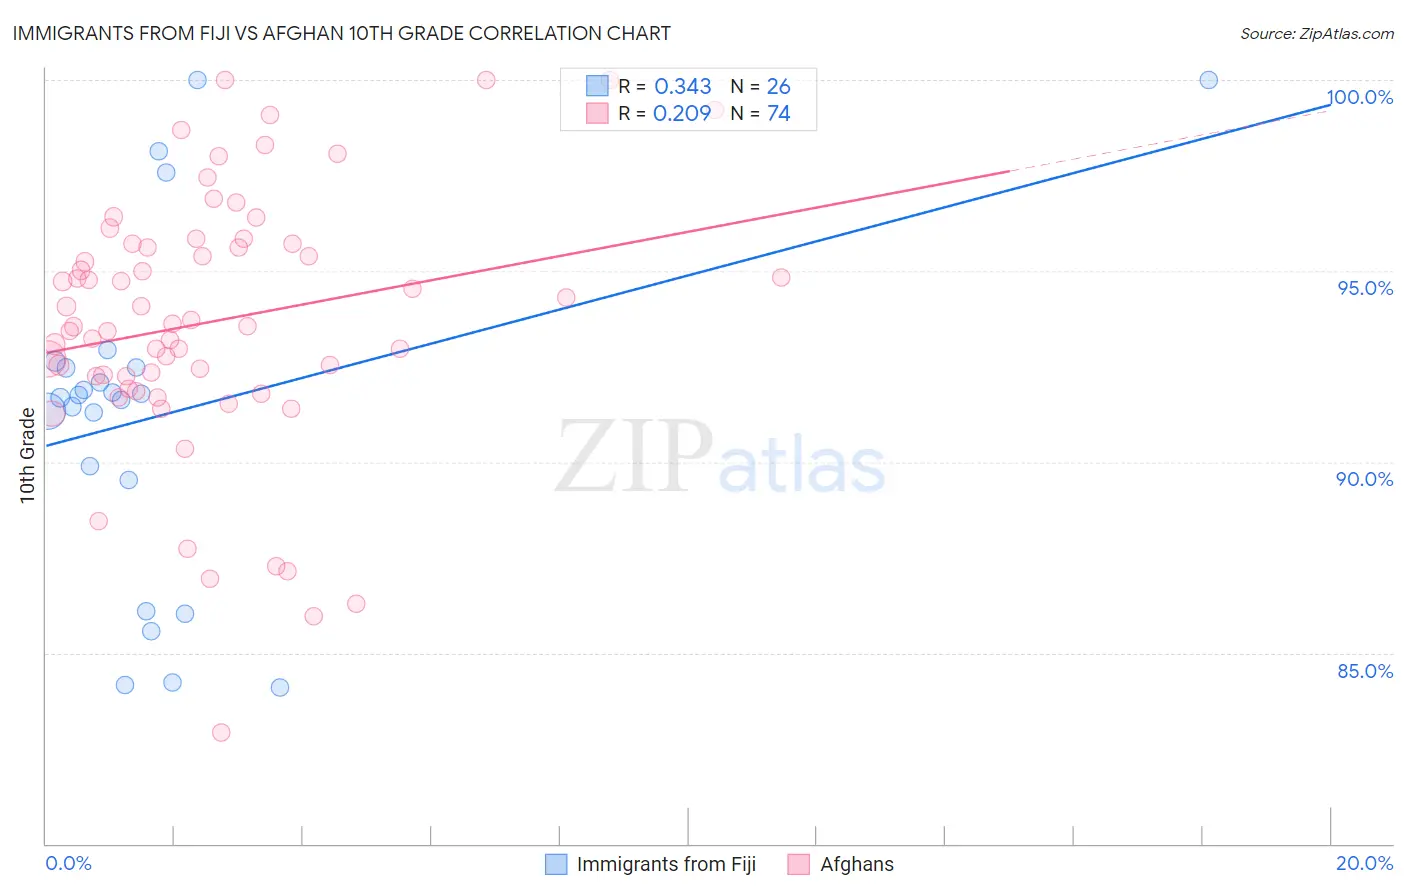
Immigrants from Fiji vs Afghan 10th Grade Correlation Chart
The statistical analysis conducted on geographies consisting of 93,756,204 people shows a mild positive correlation between the proportion of Immigrants from Fiji and percentage of population with at least 10th grade education in the United States with a correlation coefficient (R) of 0.343 and weighted average of 91.0%. Similarly, the statistical analysis conducted on geographies consisting of 148,851,685 people shows a weak positive correlation between the proportion of Afghans and percentage of population with at least 10th grade education in the United States with a correlation coefficient (R) of 0.209 and weighted average of 93.1%, a difference of 2.3%.
10th Grade Correlation Summary
| Measurement | Immigrants from Fiji | Afghan |
| Minimum | 84.1% | 82.9% |
| Maximum | 100.0% | 100.0% |
| Range | 15.9% | 17.1% |
| Mean | 91.2% | 93.7% |
| Median | 91.7% | 93.6% |
| Interquartile 25% (IQ1) | 89.5% | 92.2% |
| Interquartile 75% (IQ3) | 92.5% | 95.7% |
| Interquartile Range (IQR) | 2.9% | 3.5% |
| Standard Deviation (Sample) | 4.4% | 3.4% |
| Standard Deviation (Population) | 4.4% | 3.4% |
Similar Demographics by 10th Grade
Demographics Similar to Immigrants from Fiji by 10th Grade
In terms of 10th grade, the demographic groups most similar to Immigrants from Fiji are Immigrants from Bangladesh (91.0%, a difference of 0.010%), Immigrants (91.0%, a difference of 0.050%), Yaqui (91.1%, a difference of 0.060%), Vietnamese (90.9%, a difference of 0.090%), and Immigrants from Cambodia (90.9%, a difference of 0.11%).
| Demographics | Rating | Rank | 10th Grade |
| Guyanese | 0.0 /100 | #300 | Tragic 91.4% |
| Japanese | 0.0 /100 | #301 | Tragic 91.2% |
| Immigrants | Guyana | 0.0 /100 | #302 | Tragic 91.2% |
| Immigrants | Vietnam | 0.0 /100 | #303 | Tragic 91.2% |
| Pima | 0.0 /100 | #304 | Tragic 91.2% |
| Immigrants | Dominica | 0.0 /100 | #305 | Tragic 91.1% |
| Yaqui | 0.0 /100 | #306 | Tragic 91.1% |
| Immigrants | Fiji | 0.0 /100 | #307 | Tragic 91.0% |
| Immigrants | Bangladesh | 0.0 /100 | #308 | Tragic 91.0% |
| Immigrants | Immigrants | 0.0 /100 | #309 | Tragic 91.0% |
| Vietnamese | 0.0 /100 | #310 | Tragic 90.9% |
| Immigrants | Cambodia | 0.0 /100 | #311 | Tragic 90.9% |
| Immigrants | Portugal | 0.0 /100 | #312 | Tragic 90.8% |
| Cape Verdeans | 0.0 /100 | #313 | Tragic 90.8% |
| Nepalese | 0.0 /100 | #314 | Tragic 90.7% |
Demographics Similar to Afghans by 10th Grade
In terms of 10th grade, the demographic groups most similar to Afghans are African (93.1%, a difference of 0.0%), Subsaharan African (93.1%, a difference of 0.010%), Immigrants from Panama (93.1%, a difference of 0.010%), Immigrants from Africa (93.1%, a difference of 0.020%), and South American Indian (93.1%, a difference of 0.020%).
| Demographics | Rating | Rank | 10th Grade |
| Immigrants | Ethiopia | 5.1 /100 | #229 | Tragic 93.1% |
| Immigrants | Africa | 5.0 /100 | #230 | Tragic 93.1% |
| South American Indians | 4.9 /100 | #231 | Tragic 93.1% |
| Bahamians | 4.9 /100 | #232 | Tragic 93.1% |
| Comanche | 4.9 /100 | #233 | Tragic 93.1% |
| Sub-Saharan Africans | 4.7 /100 | #234 | Tragic 93.1% |
| Africans | 4.6 /100 | #235 | Tragic 93.1% |
| Afghans | 4.5 /100 | #236 | Tragic 93.1% |
| Immigrants | Panama | 4.3 /100 | #237 | Tragic 93.1% |
| Nigerians | 4.2 /100 | #238 | Tragic 93.1% |
| Costa Ricans | 4.2 /100 | #239 | Tragic 93.1% |
| Immigrants | Hong Kong | 4.2 /100 | #240 | Tragic 93.1% |
| Immigrants | Somalia | 2.7 /100 | #241 | Tragic 93.0% |
| Immigrants | Cameroon | 2.6 /100 | #242 | Tragic 93.0% |
| Senegalese | 2.4 /100 | #243 | Tragic 93.0% |