Immigrants from Eritrea vs Immigrants from Southern Europe High School Diploma
COMPARE
Immigrants from Eritrea
Immigrants from Southern Europe
High School Diploma
High School Diploma Comparison
Immigrants from Eritrea
Immigrants from Southern Europe
87.8%
HIGH SCHOOL DIPLOMA
1.7/ 100
METRIC RATING
246th/ 347
METRIC RANK
88.7%
HIGH SCHOOL DIPLOMA
23.4/ 100
METRIC RATING
196th/ 347
METRIC RANK
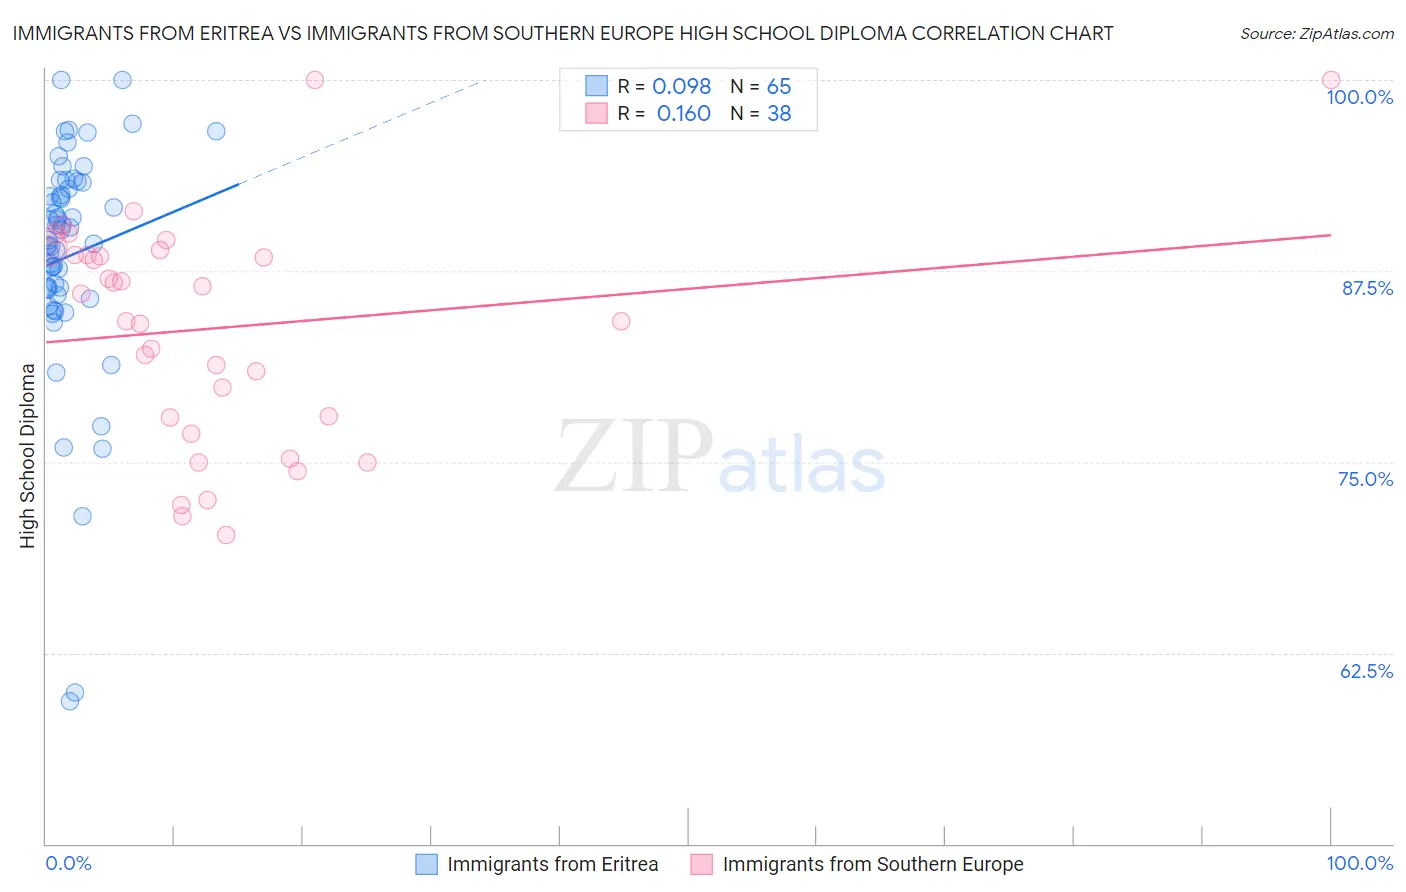
Immigrants from Eritrea vs Immigrants from Southern Europe High School Diploma Correlation Chart
The statistical analysis conducted on geographies consisting of 104,792,854 people shows a slight positive correlation between the proportion of Immigrants from Eritrea and percentage of population with at least high school diploma education in the United States with a correlation coefficient (R) of 0.098 and weighted average of 87.8%. Similarly, the statistical analysis conducted on geographies consisting of 402,804,595 people shows a poor positive correlation between the proportion of Immigrants from Southern Europe and percentage of population with at least high school diploma education in the United States with a correlation coefficient (R) of 0.160 and weighted average of 88.7%, a difference of 1.1%.
High School Diploma Correlation Summary
| Measurement | Immigrants from Eritrea | Immigrants from Southern Europe |
| Minimum | 59.3% | 70.2% |
| Maximum | 100.0% | 100.0% |
| Range | 40.7% | 29.8% |
| Mean | 88.5% | 83.7% |
| Median | 89.5% | 85.1% |
| Interquartile 25% (IQ1) | 86.1% | 77.9% |
| Interquartile 75% (IQ3) | 93.1% | 88.6% |
| Interquartile Range (IQR) | 7.0% | 10.7% |
| Standard Deviation (Sample) | 7.6% | 7.4% |
| Standard Deviation (Population) | 7.5% | 7.3% |
Similar Demographics by High School Diploma
Demographics Similar to Immigrants from Eritrea by High School Diploma
In terms of high school diploma, the demographic groups most similar to Immigrants from Eritrea are Immigrants from Costa Rica (87.8%, a difference of 0.0%), Peruvian (87.8%, a difference of 0.030%), Choctaw (87.8%, a difference of 0.040%), Spanish American (87.7%, a difference of 0.040%), and Immigrants from Philippines (87.8%, a difference of 0.050%).
| Demographics | Rating | Rank | High School Diploma |
| South Americans | 2.7 /100 | #239 | Tragic 87.9% |
| Comanche | 2.2 /100 | #240 | Tragic 87.9% |
| Immigrants | Uzbekistan | 2.1 /100 | #241 | Tragic 87.8% |
| Cheyenne | 2.1 /100 | #242 | Tragic 87.8% |
| Immigrants | Philippines | 1.9 /100 | #243 | Tragic 87.8% |
| Choctaw | 1.9 /100 | #244 | Tragic 87.8% |
| Peruvians | 1.9 /100 | #245 | Tragic 87.8% |
| Immigrants | Eritrea | 1.7 /100 | #246 | Tragic 87.8% |
| Immigrants | Costa Rica | 1.7 /100 | #247 | Tragic 87.8% |
| Spanish Americans | 1.5 /100 | #248 | Tragic 87.7% |
| Senegalese | 1.5 /100 | #249 | Tragic 87.7% |
| Immigrants | Nigeria | 1.5 /100 | #250 | Tragic 87.7% |
| Ghanaians | 1.4 /100 | #251 | Tragic 87.7% |
| Immigrants | South America | 1.2 /100 | #252 | Tragic 87.6% |
| Immigrants | Uruguay | 1.0 /100 | #253 | Tragic 87.6% |
Demographics Similar to Immigrants from Southern Europe by High School Diploma
In terms of high school diploma, the demographic groups most similar to Immigrants from Southern Europe are Afghan (88.8%, a difference of 0.010%), French American Indian (88.7%, a difference of 0.040%), Immigrants from Venezuela (88.8%, a difference of 0.050%), Immigrants from Oceania (88.8%, a difference of 0.070%), and Liberian (88.7%, a difference of 0.11%).
| Demographics | Rating | Rank | High School Diploma |
| Immigrants | Uganda | 32.6 /100 | #189 | Fair 88.9% |
| Immigrants | Chile | 31.9 /100 | #190 | Fair 88.9% |
| Immigrants | Ethiopia | 30.9 /100 | #191 | Fair 88.9% |
| Moroccans | 29.5 /100 | #192 | Fair 88.8% |
| Immigrants | Oceania | 26.9 /100 | #193 | Fair 88.8% |
| Immigrants | Venezuela | 25.8 /100 | #194 | Fair 88.8% |
| Afghans | 23.9 /100 | #195 | Fair 88.8% |
| Immigrants | Southern Europe | 23.4 /100 | #196 | Fair 88.7% |
| French American Indians | 21.5 /100 | #197 | Fair 88.7% |
| Liberians | 18.8 /100 | #198 | Poor 88.7% |
| Marshallese | 18.7 /100 | #199 | Poor 88.6% |
| Hawaiians | 18.3 /100 | #200 | Poor 88.6% |
| Koreans | 18.1 /100 | #201 | Poor 88.6% |
| Panamanians | 18.0 /100 | #202 | Poor 88.6% |
| Somalis | 17.5 /100 | #203 | Poor 88.6% |