Immigrants from Eritrea vs Bulgarian Nursery School
COMPARE
Immigrants from Eritrea
Bulgarian
Nursery School
Nursery School Comparison
Immigrants from Eritrea
Bulgarians
97.2%
NURSERY SCHOOL
0.0/ 100
METRIC RATING
296th/ 347
METRIC RANK
98.4%
NURSERY SCHOOL
99.8/ 100
METRIC RATING
58th/ 347
METRIC RANK
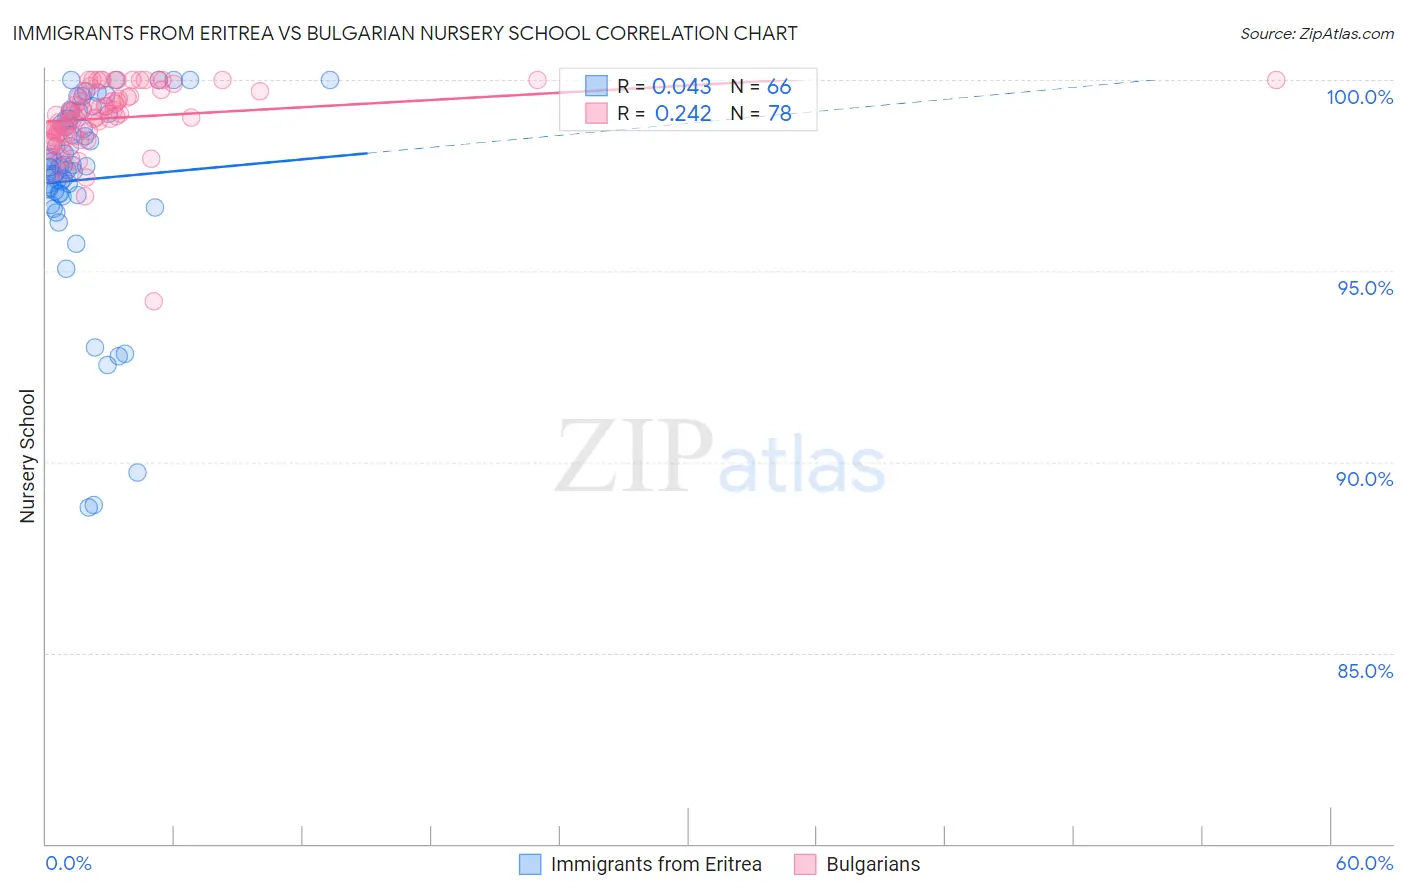
Immigrants from Eritrea vs Bulgarian Nursery School Correlation Chart
The statistical analysis conducted on geographies consisting of 104,853,741 people shows no correlation between the proportion of Immigrants from Eritrea and percentage of population with at least nursery school education in the United States with a correlation coefficient (R) of 0.043 and weighted average of 97.2%. Similarly, the statistical analysis conducted on geographies consisting of 205,633,223 people shows a weak positive correlation between the proportion of Bulgarians and percentage of population with at least nursery school education in the United States with a correlation coefficient (R) of 0.242 and weighted average of 98.4%, a difference of 1.2%.
Nursery School Correlation Summary
| Measurement | Immigrants from Eritrea | Bulgarian |
| Minimum | 88.8% | 94.2% |
| Maximum | 100.0% | 100.0% |
| Range | 11.2% | 5.8% |
| Mean | 97.4% | 99.0% |
| Median | 97.7% | 99.1% |
| Interquartile 25% (IQ1) | 97.0% | 98.6% |
| Interquartile 75% (IQ3) | 99.0% | 99.7% |
| Interquartile Range (IQR) | 2.0% | 1.1% |
| Standard Deviation (Sample) | 2.5% | 0.90% |
| Standard Deviation (Population) | 2.5% | 0.90% |
Similar Demographics by Nursery School
Demographics Similar to Immigrants from Eritrea by Nursery School
In terms of nursery school, the demographic groups most similar to Immigrants from Eritrea are Immigrants (97.2%, a difference of 0.010%), Immigrants from Grenada (97.3%, a difference of 0.020%), Malaysian (97.3%, a difference of 0.030%), Houma (97.3%, a difference of 0.040%), and Immigrants from Cuba (97.2%, a difference of 0.040%).
| Demographics | Rating | Rank | Nursery School |
| Immigrants | St. Vincent and the Grenadines | 0.0 /100 | #289 | Tragic 97.3% |
| Immigrants | Afghanistan | 0.0 /100 | #290 | Tragic 97.3% |
| British West Indians | 0.0 /100 | #291 | Tragic 97.3% |
| Houma | 0.0 /100 | #292 | Tragic 97.3% |
| Malaysians | 0.0 /100 | #293 | Tragic 97.3% |
| Immigrants | Grenada | 0.0 /100 | #294 | Tragic 97.3% |
| Immigrants | Immigrants | 0.0 /100 | #295 | Tragic 97.2% |
| Immigrants | Eritrea | 0.0 /100 | #296 | Tragic 97.2% |
| Immigrants | Cuba | 0.0 /100 | #297 | Tragic 97.2% |
| Central American Indians | 0.0 /100 | #298 | Tragic 97.2% |
| Immigrants | Dominica | 0.0 /100 | #299 | Tragic 97.2% |
| Haitians | 0.0 /100 | #300 | Tragic 97.2% |
| Immigrants | South Eastern Asia | 0.0 /100 | #301 | Tragic 97.1% |
| Immigrants | Caribbean | 0.0 /100 | #302 | Tragic 97.1% |
| Nicaraguans | 0.0 /100 | #303 | Tragic 97.1% |
Demographics Similar to Bulgarians by Nursery School
In terms of nursery school, the demographic groups most similar to Bulgarians are American (98.4%, a difference of 0.0%), Austrian (98.4%, a difference of 0.0%), Immigrants from Canada (98.4%, a difference of 0.0%), Slavic (98.4%, a difference of 0.0%), and Pueblo (98.4%, a difference of 0.010%).
| Demographics | Rating | Rank | Nursery School |
| Estonians | 99.8 /100 | #51 | Exceptional 98.5% |
| Australians | 99.8 /100 | #52 | Exceptional 98.5% |
| Kiowa | 99.8 /100 | #53 | Exceptional 98.4% |
| Pueblo | 99.8 /100 | #54 | Exceptional 98.4% |
| Immigrants | Scotland | 99.8 /100 | #55 | Exceptional 98.4% |
| Americans | 99.8 /100 | #56 | Exceptional 98.4% |
| Austrians | 99.8 /100 | #57 | Exceptional 98.4% |
| Bulgarians | 99.8 /100 | #58 | Exceptional 98.4% |
| Immigrants | Canada | 99.8 /100 | #59 | Exceptional 98.4% |
| Slavs | 99.8 /100 | #60 | Exceptional 98.4% |
| New Zealanders | 99.7 /100 | #61 | Exceptional 98.4% |
| Creek | 99.7 /100 | #62 | Exceptional 98.4% |
| Immigrants | North America | 99.7 /100 | #63 | Exceptional 98.4% |
| Greeks | 99.7 /100 | #64 | Exceptional 98.4% |
| Maltese | 99.7 /100 | #65 | Exceptional 98.4% |