Immigrants from England vs Nepalese 1st Grade
COMPARE
Immigrants from England
Nepalese
1st Grade
1st Grade Comparison
Immigrants from England
Nepalese
98.3%
1ST GRADE
99.3/ 100
METRIC RATING
77th/ 347
METRIC RANK
96.1%
1ST GRADE
0.0/ 100
METRIC RATING
344th/ 347
METRIC RANK
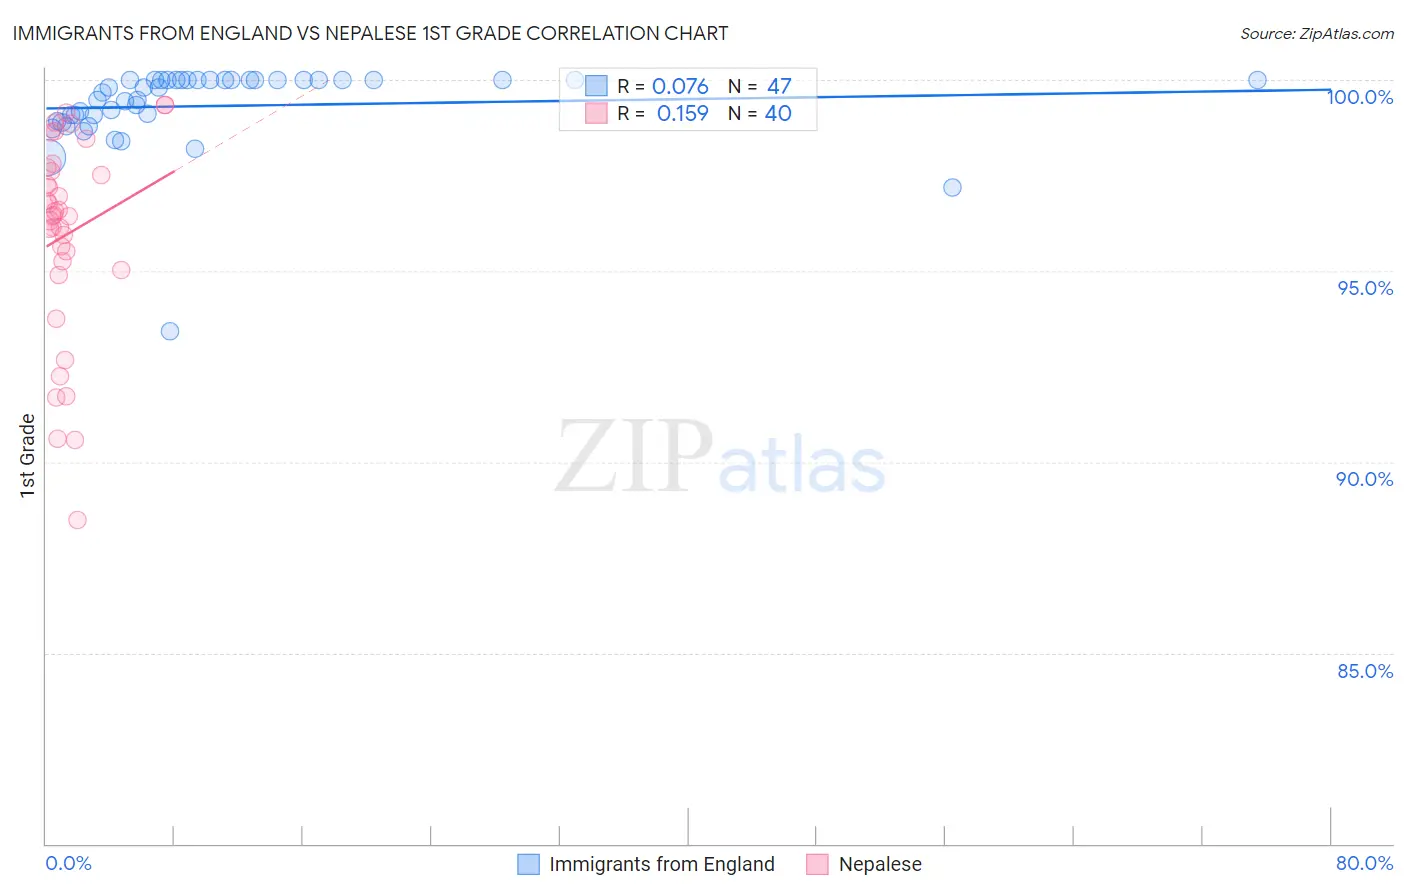
Immigrants from England vs Nepalese 1st Grade Correlation Chart
The statistical analysis conducted on geographies consisting of 391,898,018 people shows a slight positive correlation between the proportion of Immigrants from England and percentage of population with at least 1st grade education in the United States with a correlation coefficient (R) of 0.076 and weighted average of 98.3%. Similarly, the statistical analysis conducted on geographies consisting of 24,521,755 people shows a poor positive correlation between the proportion of Nepalese and percentage of population with at least 1st grade education in the United States with a correlation coefficient (R) of 0.159 and weighted average of 96.1%, a difference of 2.2%.
1st Grade Correlation Summary
| Measurement | Immigrants from England | Nepalese |
| Minimum | 93.4% | 88.5% |
| Maximum | 100.0% | 99.3% |
| Range | 6.6% | 10.8% |
| Mean | 99.3% | 96.0% |
| Median | 99.8% | 96.4% |
| Interquartile 25% (IQ1) | 98.9% | 95.1% |
| Interquartile 75% (IQ3) | 100.0% | 97.7% |
| Interquartile Range (IQR) | 1.1% | 2.5% |
| Standard Deviation (Sample) | 1.1% | 2.6% |
| Standard Deviation (Population) | 1.1% | 2.6% |
Similar Demographics by 1st Grade
Demographics Similar to Immigrants from England by 1st Grade
In terms of 1st grade, the demographic groups most similar to Immigrants from England are Cherokee (98.3%, a difference of 0.0%), Shoshone (98.3%, a difference of 0.0%), Immigrants from Netherlands (98.3%, a difference of 0.010%), Immigrants from Belgium (98.3%, a difference of 0.010%), and Immigrants from Lithuania (98.3%, a difference of 0.010%).
| Demographics | Rating | Rank | 1st Grade |
| Russians | 99.6 /100 | #70 | Exceptional 98.3% |
| Serbians | 99.6 /100 | #71 | Exceptional 98.3% |
| Cheyenne | 99.6 /100 | #72 | Exceptional 98.3% |
| Cajuns | 99.5 /100 | #73 | Exceptional 98.3% |
| Immigrants | Netherlands | 99.4 /100 | #74 | Exceptional 98.3% |
| Cherokee | 99.3 /100 | #75 | Exceptional 98.3% |
| Shoshone | 99.3 /100 | #76 | Exceptional 98.3% |
| Immigrants | England | 99.3 /100 | #77 | Exceptional 98.3% |
| Immigrants | Belgium | 99.2 /100 | #78 | Exceptional 98.3% |
| Immigrants | Lithuania | 99.2 /100 | #79 | Exceptional 98.3% |
| Osage | 99.2 /100 | #80 | Exceptional 98.3% |
| Potawatomi | 99.1 /100 | #81 | Exceptional 98.3% |
| Icelanders | 99.1 /100 | #82 | Exceptional 98.3% |
| Immigrants | Sweden | 99.1 /100 | #83 | Exceptional 98.3% |
| Delaware | 99.1 /100 | #84 | Exceptional 98.3% |
Demographics Similar to Nepalese by 1st Grade
In terms of 1st grade, the demographic groups most similar to Nepalese are Immigrants from El Salvador (96.1%, a difference of 0.030%), Salvadoran (96.3%, a difference of 0.13%), Immigrants from Mexico (96.3%, a difference of 0.16%), Immigrants from Central America (96.3%, a difference of 0.19%), and Immigrants from Cabo Verde (96.3%, a difference of 0.21%).
| Demographics | Rating | Rank | 1st Grade |
| Immigrants | Dominican Republic | 0.0 /100 | #333 | Tragic 96.5% |
| Bangladeshis | 0.0 /100 | #334 | Tragic 96.5% |
| Yakama | 0.0 /100 | #335 | Tragic 96.5% |
| Guatemalans | 0.0 /100 | #336 | Tragic 96.5% |
| Immigrants | Cambodia | 0.0 /100 | #337 | Tragic 96.5% |
| Immigrants | Fiji | 0.0 /100 | #338 | Tragic 96.4% |
| Immigrants | Guatemala | 0.0 /100 | #339 | Tragic 96.4% |
| Immigrants | Cabo Verde | 0.0 /100 | #340 | Tragic 96.3% |
| Immigrants | Central America | 0.0 /100 | #341 | Tragic 96.3% |
| Immigrants | Mexico | 0.0 /100 | #342 | Tragic 96.3% |
| Salvadorans | 0.0 /100 | #343 | Tragic 96.3% |
| Nepalese | 0.0 /100 | #344 | Tragic 96.1% |
| Immigrants | El Salvador | 0.0 /100 | #345 | Tragic 96.1% |
| Immigrants | Yemen | 0.0 /100 | #346 | Tragic 95.8% |
| Spanish American Indians | 0.0 /100 | #347 | Tragic 95.7% |