Immigrants from Canada vs Nepalese 1st Grade
COMPARE
Immigrants from Canada
Nepalese
1st Grade
1st Grade Comparison
Immigrants from Canada
Nepalese
98.4%
1ST GRADE
99.7/ 100
METRIC RATING
60th/ 347
METRIC RANK
96.1%
1ST GRADE
0.0/ 100
METRIC RATING
344th/ 347
METRIC RANK
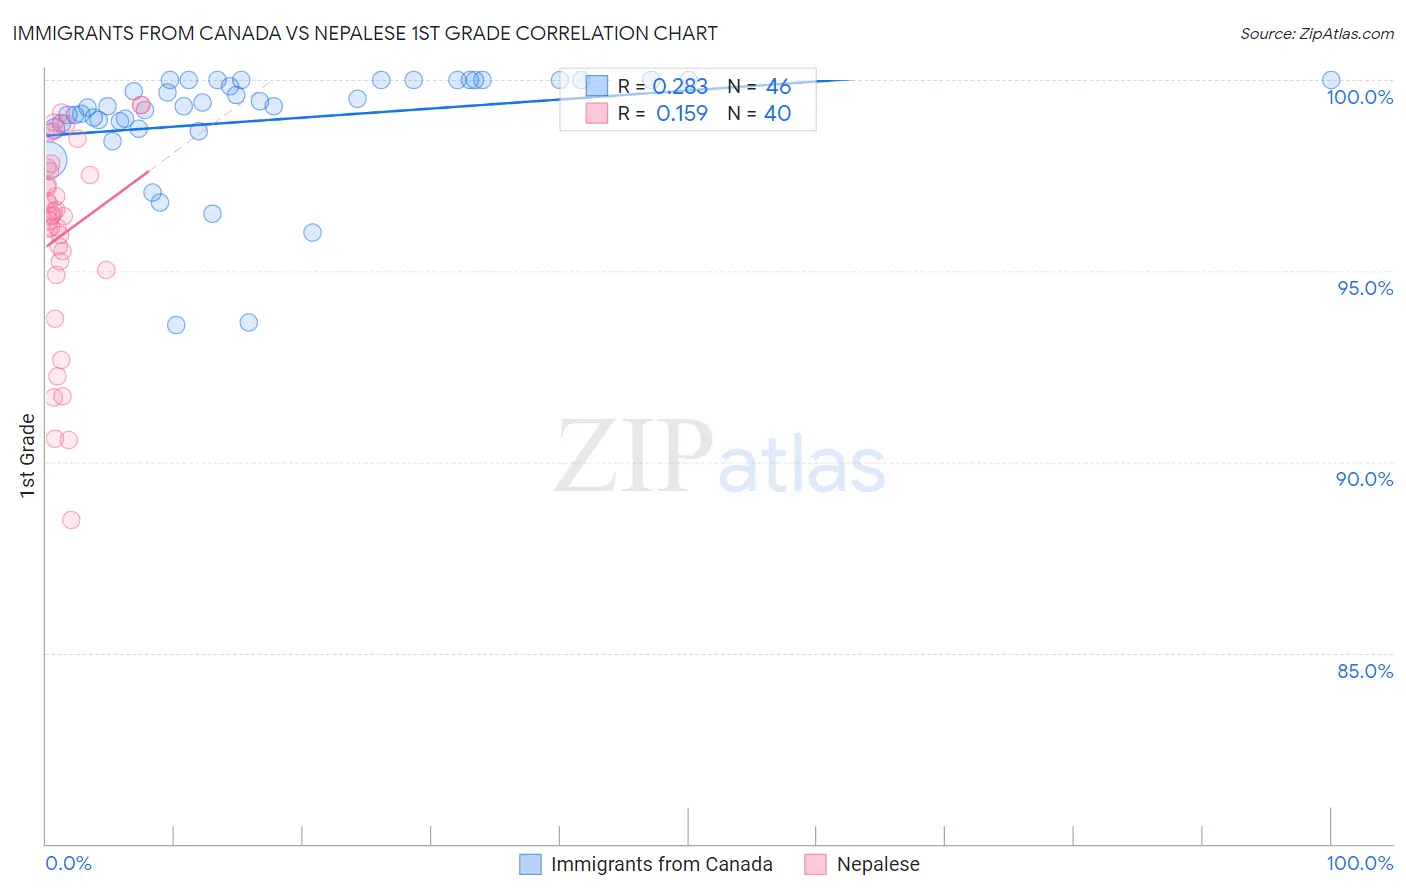
Immigrants from Canada vs Nepalese 1st Grade Correlation Chart
The statistical analysis conducted on geographies consisting of 459,397,554 people shows a weak positive correlation between the proportion of Immigrants from Canada and percentage of population with at least 1st grade education in the United States with a correlation coefficient (R) of 0.283 and weighted average of 98.4%. Similarly, the statistical analysis conducted on geographies consisting of 24,521,755 people shows a poor positive correlation between the proportion of Nepalese and percentage of population with at least 1st grade education in the United States with a correlation coefficient (R) of 0.159 and weighted average of 96.1%, a difference of 2.3%.
1st Grade Correlation Summary
| Measurement | Immigrants from Canada | Nepalese |
| Minimum | 93.6% | 88.5% |
| Maximum | 100.0% | 99.3% |
| Range | 6.4% | 10.8% |
| Mean | 98.9% | 96.0% |
| Median | 99.3% | 96.4% |
| Interquartile 25% (IQ1) | 98.9% | 95.1% |
| Interquartile 75% (IQ3) | 100.0% | 97.7% |
| Interquartile Range (IQR) | 1.1% | 2.5% |
| Standard Deviation (Sample) | 1.5% | 2.6% |
| Standard Deviation (Population) | 1.5% | 2.6% |
Similar Demographics by 1st Grade
Demographics Similar to Immigrants from Canada by 1st Grade
In terms of 1st grade, the demographic groups most similar to Immigrants from Canada are New Zealander (98.4%, a difference of 0.0%), Creek (98.4%, a difference of 0.0%), Bulgarian (98.4%, a difference of 0.0%), Slavic (98.4%, a difference of 0.0%), and Immigrants from North America (98.4%, a difference of 0.0%).
| Demographics | Rating | Rank | 1st Grade |
| Kiowa | 99.8 /100 | #53 | Exceptional 98.4% |
| Australians | 99.8 /100 | #54 | Exceptional 98.4% |
| Immigrants | Scotland | 99.8 /100 | #55 | Exceptional 98.4% |
| Americans | 99.8 /100 | #56 | Exceptional 98.4% |
| Austrians | 99.8 /100 | #57 | Exceptional 98.4% |
| New Zealanders | 99.7 /100 | #58 | Exceptional 98.4% |
| Creek | 99.7 /100 | #59 | Exceptional 98.4% |
| Immigrants | Canada | 99.7 /100 | #60 | Exceptional 98.4% |
| Bulgarians | 99.7 /100 | #61 | Exceptional 98.4% |
| Slavs | 99.7 /100 | #62 | Exceptional 98.4% |
| Immigrants | North America | 99.7 /100 | #63 | Exceptional 98.4% |
| Greeks | 99.7 /100 | #64 | Exceptional 98.4% |
| Maltese | 99.7 /100 | #65 | Exceptional 98.4% |
| Canadians | 99.6 /100 | #66 | Exceptional 98.3% |
| Immigrants | Austria | 99.6 /100 | #67 | Exceptional 98.3% |
Demographics Similar to Nepalese by 1st Grade
In terms of 1st grade, the demographic groups most similar to Nepalese are Immigrants from El Salvador (96.1%, a difference of 0.030%), Salvadoran (96.3%, a difference of 0.13%), Immigrants from Mexico (96.3%, a difference of 0.16%), Immigrants from Central America (96.3%, a difference of 0.19%), and Immigrants from Cabo Verde (96.3%, a difference of 0.21%).
| Demographics | Rating | Rank | 1st Grade |
| Immigrants | Dominican Republic | 0.0 /100 | #333 | Tragic 96.5% |
| Bangladeshis | 0.0 /100 | #334 | Tragic 96.5% |
| Yakama | 0.0 /100 | #335 | Tragic 96.5% |
| Guatemalans | 0.0 /100 | #336 | Tragic 96.5% |
| Immigrants | Cambodia | 0.0 /100 | #337 | Tragic 96.5% |
| Immigrants | Fiji | 0.0 /100 | #338 | Tragic 96.4% |
| Immigrants | Guatemala | 0.0 /100 | #339 | Tragic 96.4% |
| Immigrants | Cabo Verde | 0.0 /100 | #340 | Tragic 96.3% |
| Immigrants | Central America | 0.0 /100 | #341 | Tragic 96.3% |
| Immigrants | Mexico | 0.0 /100 | #342 | Tragic 96.3% |
| Salvadorans | 0.0 /100 | #343 | Tragic 96.3% |
| Nepalese | 0.0 /100 | #344 | Tragic 96.1% |
| Immigrants | El Salvador | 0.0 /100 | #345 | Tragic 96.1% |
| Immigrants | Yemen | 0.0 /100 | #346 | Tragic 95.8% |
| Spanish American Indians | 0.0 /100 | #347 | Tragic 95.7% |