Immigrants from Ecuador vs Immigrants from Costa Rica 5th Grade
COMPARE
Immigrants from Ecuador
Immigrants from Costa Rica
5th Grade
5th Grade Comparison
Immigrants from Ecuador
Immigrants from Costa Rica
95.8%
5TH GRADE
0.0/ 100
METRIC RATING
316th/ 347
METRIC RANK
96.9%
5TH GRADE
1.6/ 100
METRIC RATING
242nd/ 347
METRIC RANK
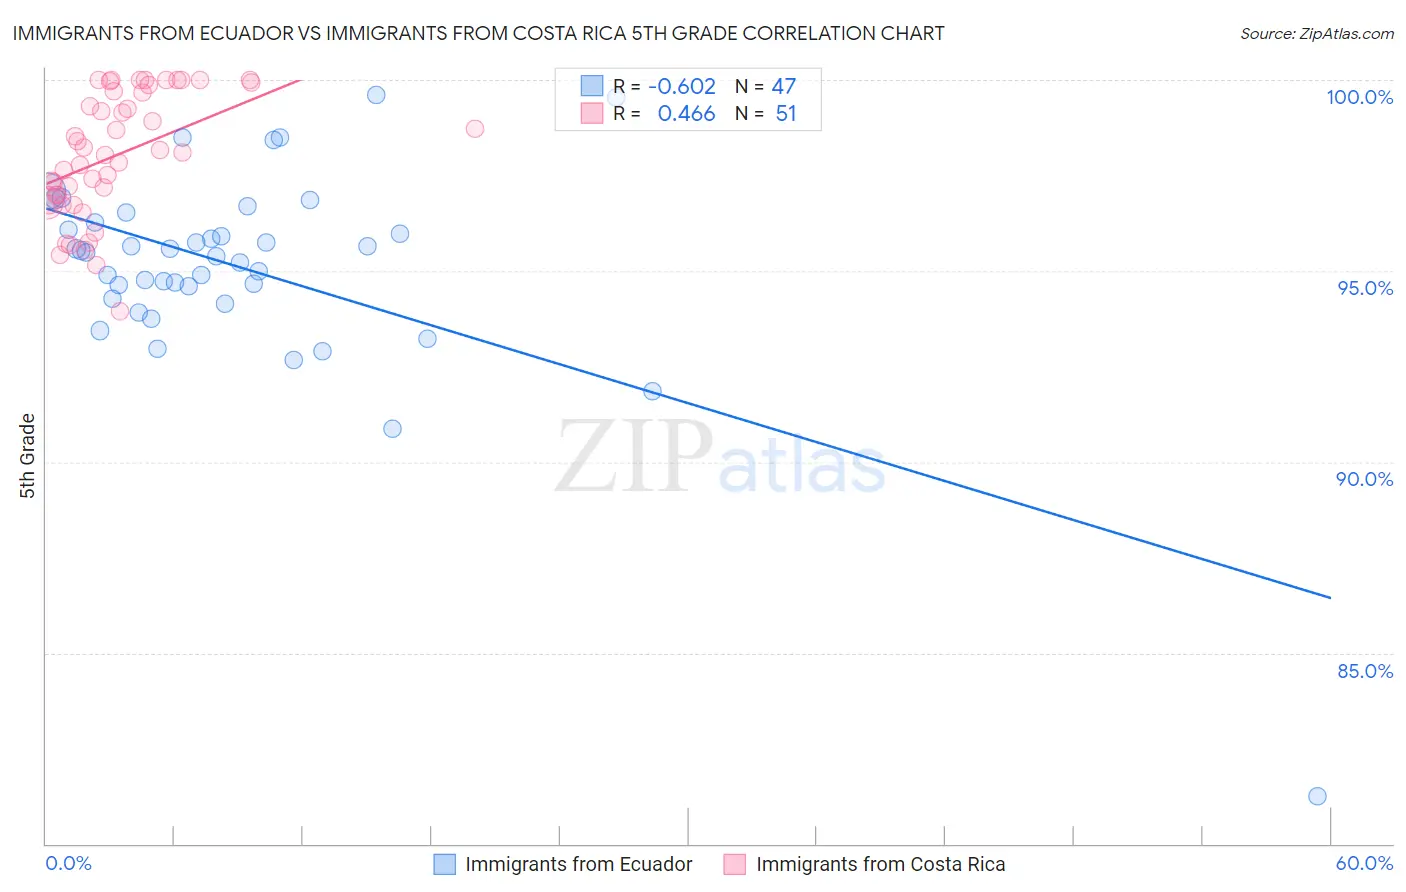
Immigrants from Ecuador vs Immigrants from Costa Rica 5th Grade Correlation Chart
The statistical analysis conducted on geographies consisting of 271,020,679 people shows a significant negative correlation between the proportion of Immigrants from Ecuador and percentage of population with at least 5th grade education in the United States with a correlation coefficient (R) of -0.602 and weighted average of 95.8%. Similarly, the statistical analysis conducted on geographies consisting of 204,275,869 people shows a moderate positive correlation between the proportion of Immigrants from Costa Rica and percentage of population with at least 5th grade education in the United States with a correlation coefficient (R) of 0.466 and weighted average of 96.9%, a difference of 1.1%.
5th Grade Correlation Summary
| Measurement | Immigrants from Ecuador | Immigrants from Costa Rica |
| Minimum | 81.2% | 93.9% |
| Maximum | 99.6% | 100.0% |
| Range | 18.3% | 6.1% |
| Mean | 95.1% | 98.0% |
| Median | 95.5% | 98.1% |
| Interquartile 25% (IQ1) | 94.3% | 96.8% |
| Interquartile 75% (IQ3) | 96.3% | 99.7% |
| Interquartile Range (IQR) | 2.0% | 2.9% |
| Standard Deviation (Sample) | 2.7% | 1.6% |
| Standard Deviation (Population) | 2.7% | 1.6% |
Similar Demographics by 5th Grade
Demographics Similar to Immigrants from Ecuador by 5th Grade
In terms of 5th grade, the demographic groups most similar to Immigrants from Ecuador are Belizean (95.8%, a difference of 0.030%), Immigrants from Vietnam (95.8%, a difference of 0.050%), Nicaraguan (95.9%, a difference of 0.060%), Bangladeshi (95.9%, a difference of 0.080%), and Immigrants from Portugal (95.9%, a difference of 0.080%).
| Demographics | Rating | Rank | 5th Grade |
| Immigrants | Guyana | 0.0 /100 | #309 | Tragic 96.0% |
| Indonesians | 0.0 /100 | #310 | Tragic 96.0% |
| Immigrants | Bangladesh | 0.0 /100 | #311 | Tragic 96.0% |
| Vietnamese | 0.0 /100 | #312 | Tragic 95.9% |
| Bangladeshis | 0.0 /100 | #313 | Tragic 95.9% |
| Immigrants | Portugal | 0.0 /100 | #314 | Tragic 95.9% |
| Nicaraguans | 0.0 /100 | #315 | Tragic 95.9% |
| Immigrants | Ecuador | 0.0 /100 | #316 | Tragic 95.8% |
| Belizeans | 0.0 /100 | #317 | Tragic 95.8% |
| Immigrants | Vietnam | 0.0 /100 | #318 | Tragic 95.8% |
| Japanese | 0.0 /100 | #319 | Tragic 95.7% |
| Central American Indians | 0.0 /100 | #320 | Tragic 95.7% |
| Immigrants | Belize | 0.0 /100 | #321 | Tragic 95.7% |
| Immigrants | Nicaragua | 0.0 /100 | #322 | Tragic 95.6% |
| Immigrants | Fiji | 0.0 /100 | #323 | Tragic 95.6% |
Demographics Similar to Immigrants from Costa Rica by 5th Grade
In terms of 5th grade, the demographic groups most similar to Immigrants from Costa Rica are Immigrants from Asia (96.9%, a difference of 0.0%), Immigrants from Eastern Africa (96.9%, a difference of 0.0%), Korean (96.9%, a difference of 0.0%), Immigrants from Indonesia (96.9%, a difference of 0.020%), and Asian (96.9%, a difference of 0.020%).
| Demographics | Rating | Rank | 5th Grade |
| Uruguayans | 3.2 /100 | #235 | Tragic 97.0% |
| Senegalese | 2.8 /100 | #236 | Tragic 97.0% |
| Immigrants | Indonesia | 2.0 /100 | #237 | Tragic 96.9% |
| Asians | 2.0 /100 | #238 | Tragic 96.9% |
| Nigerians | 1.9 /100 | #239 | Tragic 96.9% |
| Indians (Asian) | 1.9 /100 | #240 | Tragic 96.9% |
| Immigrants | Asia | 1.7 /100 | #241 | Tragic 96.9% |
| Immigrants | Costa Rica | 1.6 /100 | #242 | Tragic 96.9% |
| Immigrants | Eastern Africa | 1.6 /100 | #243 | Tragic 96.9% |
| Koreans | 1.6 /100 | #244 | Tragic 96.9% |
| Colombians | 1.3 /100 | #245 | Tragic 96.9% |
| Ethiopians | 1.2 /100 | #246 | Tragic 96.9% |
| Immigrants | Africa | 1.1 /100 | #247 | Tragic 96.9% |
| U.S. Virgin Islanders | 1.1 /100 | #248 | Tragic 96.9% |
| Immigrants | Uruguay | 1.0 /100 | #249 | Tragic 96.9% |