American vs Immigrants from Costa Rica 5th Grade
COMPARE
American
Immigrants from Costa Rica
5th Grade
5th Grade Comparison
Americans
Immigrants from Costa Rica
97.9%
5TH GRADE
99.7/ 100
METRIC RATING
59th/ 347
METRIC RANK
96.9%
5TH GRADE
1.6/ 100
METRIC RATING
242nd/ 347
METRIC RANK
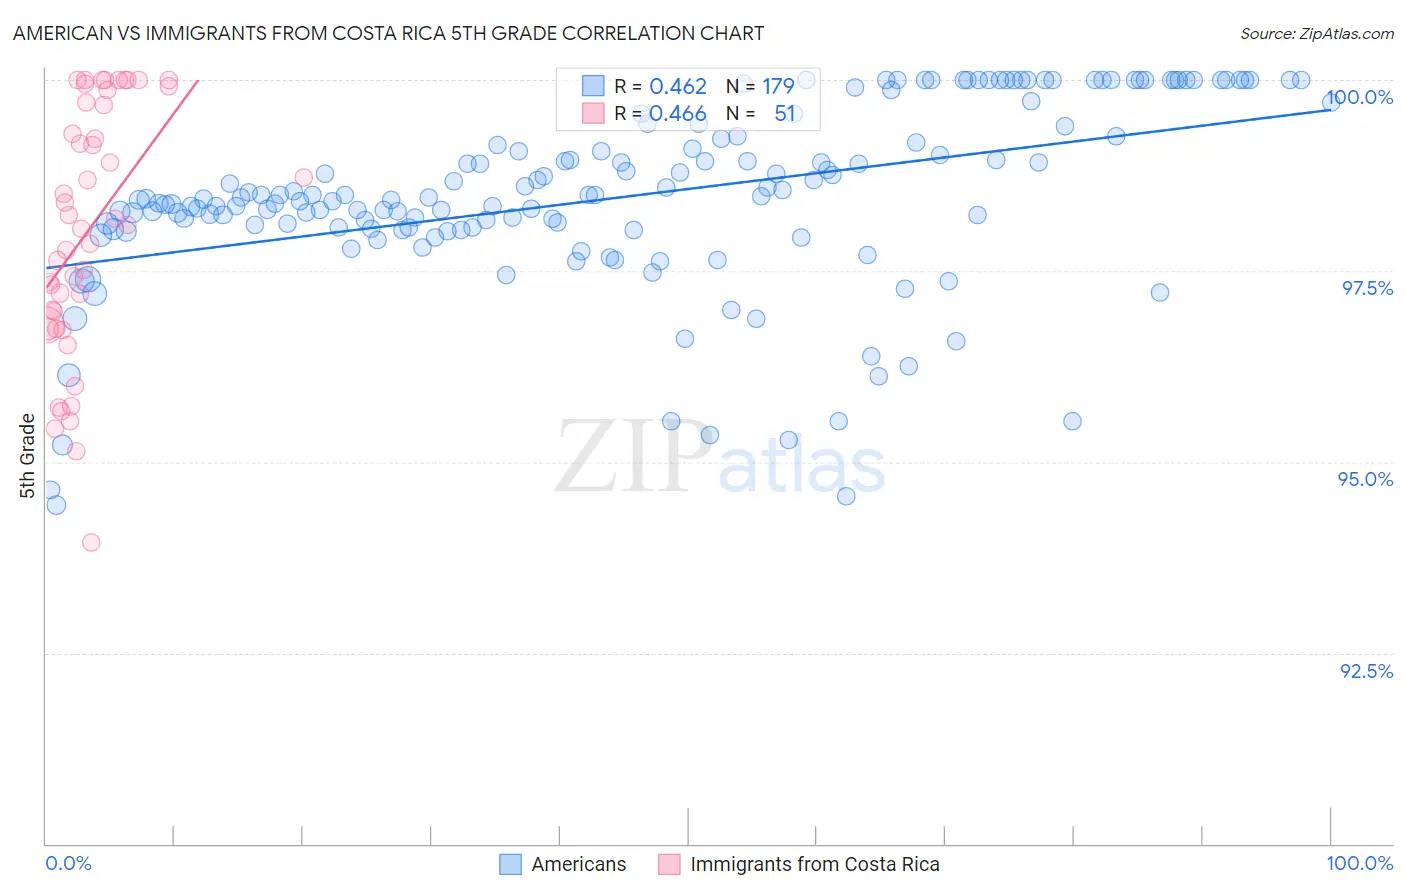
American vs Immigrants from Costa Rica 5th Grade Correlation Chart
The statistical analysis conducted on geographies consisting of 581,993,401 people shows a moderate positive correlation between the proportion of Americans and percentage of population with at least 5th grade education in the United States with a correlation coefficient (R) of 0.462 and weighted average of 97.9%. Similarly, the statistical analysis conducted on geographies consisting of 204,275,869 people shows a moderate positive correlation between the proportion of Immigrants from Costa Rica and percentage of population with at least 5th grade education in the United States with a correlation coefficient (R) of 0.466 and weighted average of 96.9%, a difference of 1.1%.
5th Grade Correlation Summary
| Measurement | American | Immigrants from Costa Rica |
| Minimum | 94.4% | 93.9% |
| Maximum | 100.0% | 100.0% |
| Range | 5.6% | 6.1% |
| Mean | 98.5% | 98.0% |
| Median | 98.5% | 98.1% |
| Interquartile 25% (IQ1) | 98.0% | 96.8% |
| Interquartile 75% (IQ3) | 99.3% | 99.7% |
| Interquartile Range (IQR) | 1.2% | 2.9% |
| Standard Deviation (Sample) | 1.2% | 1.6% |
| Standard Deviation (Population) | 1.2% | 1.6% |
Similar Demographics by 5th Grade
Demographics Similar to Americans by 5th Grade
In terms of 5th grade, the demographic groups most similar to Americans are Greek (97.9%, a difference of 0.010%), Austrian (97.9%, a difference of 0.010%), White/Caucasian (97.9%, a difference of 0.010%), Immigrants from Canada (97.9%, a difference of 0.010%), and Australian (98.0%, a difference of 0.020%).
| Demographics | Rating | Rank | 5th Grade |
| Maltese | 99.8 /100 | #52 | Exceptional 98.0% |
| Slavs | 99.8 /100 | #53 | Exceptional 98.0% |
| Australians | 99.8 /100 | #54 | Exceptional 98.0% |
| Creek | 99.8 /100 | #55 | Exceptional 98.0% |
| Greeks | 99.8 /100 | #56 | Exceptional 97.9% |
| Austrians | 99.8 /100 | #57 | Exceptional 97.9% |
| Whites/Caucasians | 99.8 /100 | #58 | Exceptional 97.9% |
| Americans | 99.7 /100 | #59 | Exceptional 97.9% |
| Immigrants | Canada | 99.7 /100 | #60 | Exceptional 97.9% |
| Serbians | 99.7 /100 | #61 | Exceptional 97.9% |
| Immigrants | North America | 99.7 /100 | #62 | Exceptional 97.9% |
| Russians | 99.7 /100 | #63 | Exceptional 97.9% |
| Immigrants | Northern Europe | 99.6 /100 | #64 | Exceptional 97.9% |
| Canadians | 99.6 /100 | #65 | Exceptional 97.9% |
| Immigrants | Austria | 99.6 /100 | #66 | Exceptional 97.9% |
Demographics Similar to Immigrants from Costa Rica by 5th Grade
In terms of 5th grade, the demographic groups most similar to Immigrants from Costa Rica are Immigrants from Asia (96.9%, a difference of 0.0%), Immigrants from Eastern Africa (96.9%, a difference of 0.0%), Korean (96.9%, a difference of 0.0%), Immigrants from Indonesia (96.9%, a difference of 0.020%), and Asian (96.9%, a difference of 0.020%).
| Demographics | Rating | Rank | 5th Grade |
| Uruguayans | 3.2 /100 | #235 | Tragic 97.0% |
| Senegalese | 2.8 /100 | #236 | Tragic 97.0% |
| Immigrants | Indonesia | 2.0 /100 | #237 | Tragic 96.9% |
| Asians | 2.0 /100 | #238 | Tragic 96.9% |
| Nigerians | 1.9 /100 | #239 | Tragic 96.9% |
| Indians (Asian) | 1.9 /100 | #240 | Tragic 96.9% |
| Immigrants | Asia | 1.7 /100 | #241 | Tragic 96.9% |
| Immigrants | Costa Rica | 1.6 /100 | #242 | Tragic 96.9% |
| Immigrants | Eastern Africa | 1.6 /100 | #243 | Tragic 96.9% |
| Koreans | 1.6 /100 | #244 | Tragic 96.9% |
| Colombians | 1.3 /100 | #245 | Tragic 96.9% |
| Ethiopians | 1.2 /100 | #246 | Tragic 96.9% |
| Immigrants | Africa | 1.1 /100 | #247 | Tragic 96.9% |
| U.S. Virgin Islanders | 1.1 /100 | #248 | Tragic 96.9% |
| Immigrants | Uruguay | 1.0 /100 | #249 | Tragic 96.9% |