Immigrants from Eastern Asia vs Scandinavian 4th Grade
COMPARE
Immigrants from Eastern Asia
Scandinavian
4th Grade
4th Grade Comparison
Immigrants from Eastern Asia
Scandinavians
97.2%
4TH GRADE
2.7/ 100
METRIC RATING
236th/ 347
METRIC RANK
98.3%
4TH GRADE
100.0/ 100
METRIC RATING
30th/ 347
METRIC RANK
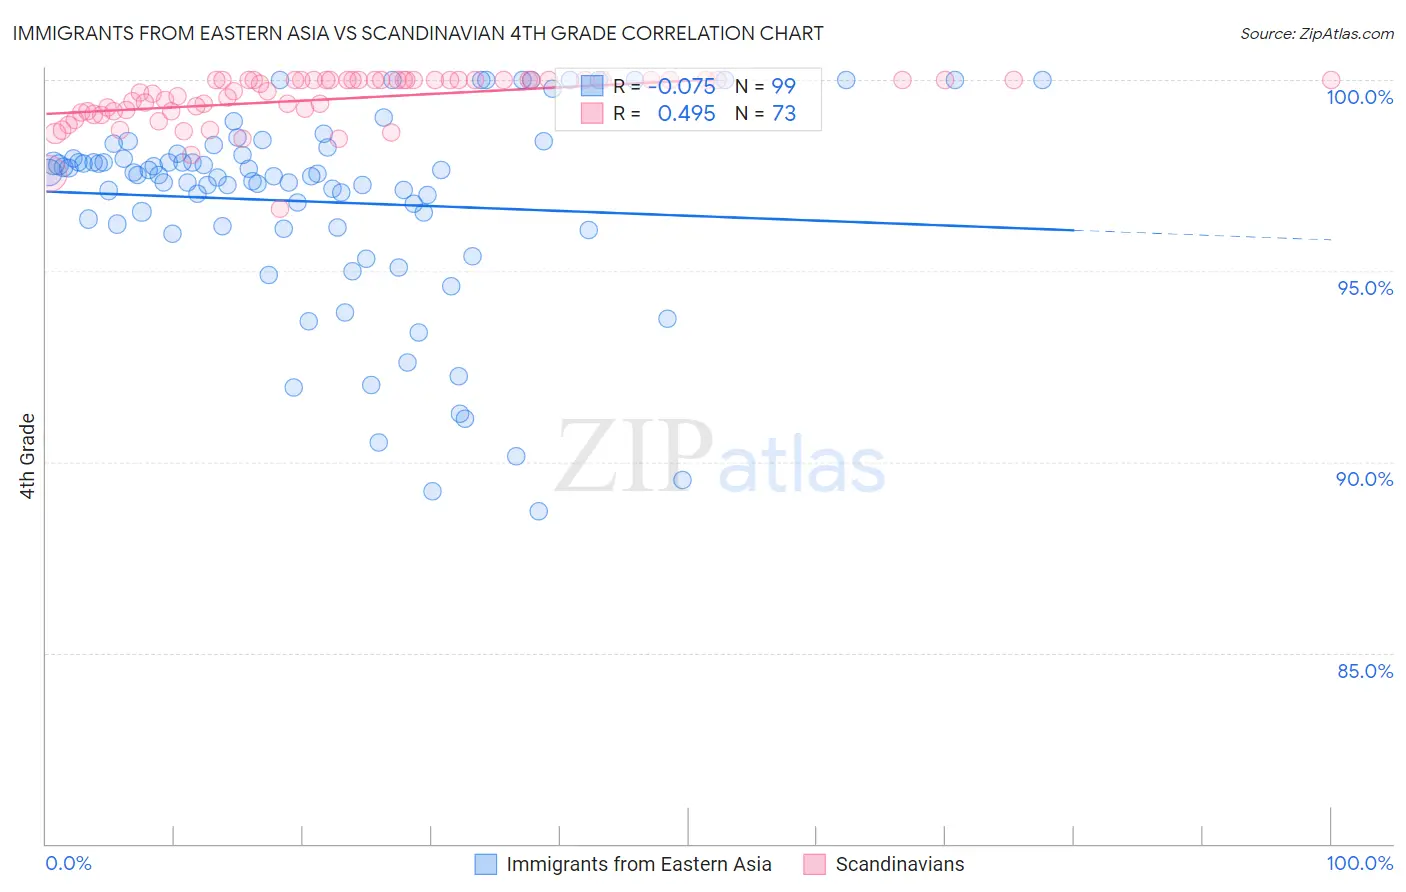
Immigrants from Eastern Asia vs Scandinavian 4th Grade Correlation Chart
The statistical analysis conducted on geographies consisting of 499,865,893 people shows a slight negative correlation between the proportion of Immigrants from Eastern Asia and percentage of population with at least 4th grade education in the United States with a correlation coefficient (R) of -0.075 and weighted average of 97.2%. Similarly, the statistical analysis conducted on geographies consisting of 472,660,430 people shows a moderate positive correlation between the proportion of Scandinavians and percentage of population with at least 4th grade education in the United States with a correlation coefficient (R) of 0.495 and weighted average of 98.3%, a difference of 1.1%.
4th Grade Correlation Summary
| Measurement | Immigrants from Eastern Asia | Scandinavian |
| Minimum | 88.7% | 96.6% |
| Maximum | 100.0% | 100.0% |
| Range | 11.3% | 3.4% |
| Mean | 96.8% | 99.5% |
| Median | 97.5% | 99.9% |
| Interquartile 25% (IQ1) | 96.1% | 99.2% |
| Interquartile 75% (IQ3) | 98.1% | 100.0% |
| Interquartile Range (IQR) | 2.0% | 0.82% |
| Standard Deviation (Sample) | 2.6% | 0.67% |
| Standard Deviation (Population) | 2.6% | 0.66% |
Similar Demographics by 4th Grade
Demographics Similar to Immigrants from Eastern Asia by 4th Grade
In terms of 4th grade, the demographic groups most similar to Immigrants from Eastern Asia are Senegalese (97.2%, a difference of 0.010%), Assyrian/Chaldean/Syriac (97.2%, a difference of 0.010%), Yuman (97.2%, a difference of 0.010%), Uruguayan (97.2%, a difference of 0.020%), and Immigrants from Malaysia (97.2%, a difference of 0.020%).
| Demographics | Rating | Rank | 4th Grade |
| Liberians | 3.6 /100 | #229 | Tragic 97.2% |
| Uruguayans | 3.5 /100 | #230 | Tragic 97.2% |
| Immigrants | Malaysia | 3.4 /100 | #231 | Tragic 97.2% |
| Immigrants | Western Asia | 3.4 /100 | #232 | Tragic 97.2% |
| Senegalese | 3.1 /100 | #233 | Tragic 97.2% |
| Assyrians/Chaldeans/Syriacs | 3.0 /100 | #234 | Tragic 97.2% |
| Yuman | 2.9 /100 | #235 | Tragic 97.2% |
| Immigrants | Eastern Asia | 2.7 /100 | #236 | Tragic 97.2% |
| Immigrants | Costa Rica | 2.0 /100 | #237 | Tragic 97.2% |
| Indians (Asian) | 1.9 /100 | #238 | Tragic 97.2% |
| Nigerians | 1.8 /100 | #239 | Tragic 97.1% |
| Colombians | 1.6 /100 | #240 | Tragic 97.1% |
| Immigrants | Indonesia | 1.5 /100 | #241 | Tragic 97.1% |
| Asians | 1.4 /100 | #242 | Tragic 97.1% |
| U.S. Virgin Islanders | 1.4 /100 | #243 | Tragic 97.1% |
Demographics Similar to Scandinavians by 4th Grade
In terms of 4th grade, the demographic groups most similar to Scandinavians are European (98.3%, a difference of 0.0%), Czech (98.3%, a difference of 0.010%), French Canadian (98.3%, a difference of 0.020%), French (98.3%, a difference of 0.020%), and Scotch-Irish (98.3%, a difference of 0.030%).
| Demographics | Rating | Rank | 4th Grade |
| Sioux | 100.0 /100 | #23 | Exceptional 98.3% |
| Danes | 100.0 /100 | #24 | Exceptional 98.3% |
| Scotch-Irish | 100.0 /100 | #25 | Exceptional 98.3% |
| Croatians | 100.0 /100 | #26 | Exceptional 98.3% |
| French Canadians | 100.0 /100 | #27 | Exceptional 98.3% |
| French | 100.0 /100 | #28 | Exceptional 98.3% |
| Czechs | 100.0 /100 | #29 | Exceptional 98.3% |
| Scandinavians | 100.0 /100 | #30 | Exceptional 98.3% |
| Europeans | 100.0 /100 | #31 | Exceptional 98.3% |
| Chinese | 100.0 /100 | #32 | Exceptional 98.3% |
| Swiss | 100.0 /100 | #33 | Exceptional 98.2% |
| Chippewa | 100.0 /100 | #34 | Exceptional 98.2% |
| Italians | 100.0 /100 | #35 | Exceptional 98.2% |
| British | 100.0 /100 | #36 | Exceptional 98.2% |
| Latvians | 99.9 /100 | #37 | Exceptional 98.2% |