Immigrants from Eastern Asia vs Immigrants from Cabo Verde 4th Grade
COMPARE
Immigrants from Eastern Asia
Immigrants from Cabo Verde
4th Grade
4th Grade Comparison
Immigrants from Eastern Asia
Immigrants from Cabo Verde
97.2%
4TH GRADE
2.7/ 100
METRIC RATING
236th/ 347
METRIC RANK
95.7%
4TH GRADE
0.0/ 100
METRIC RATING
334th/ 347
METRIC RANK
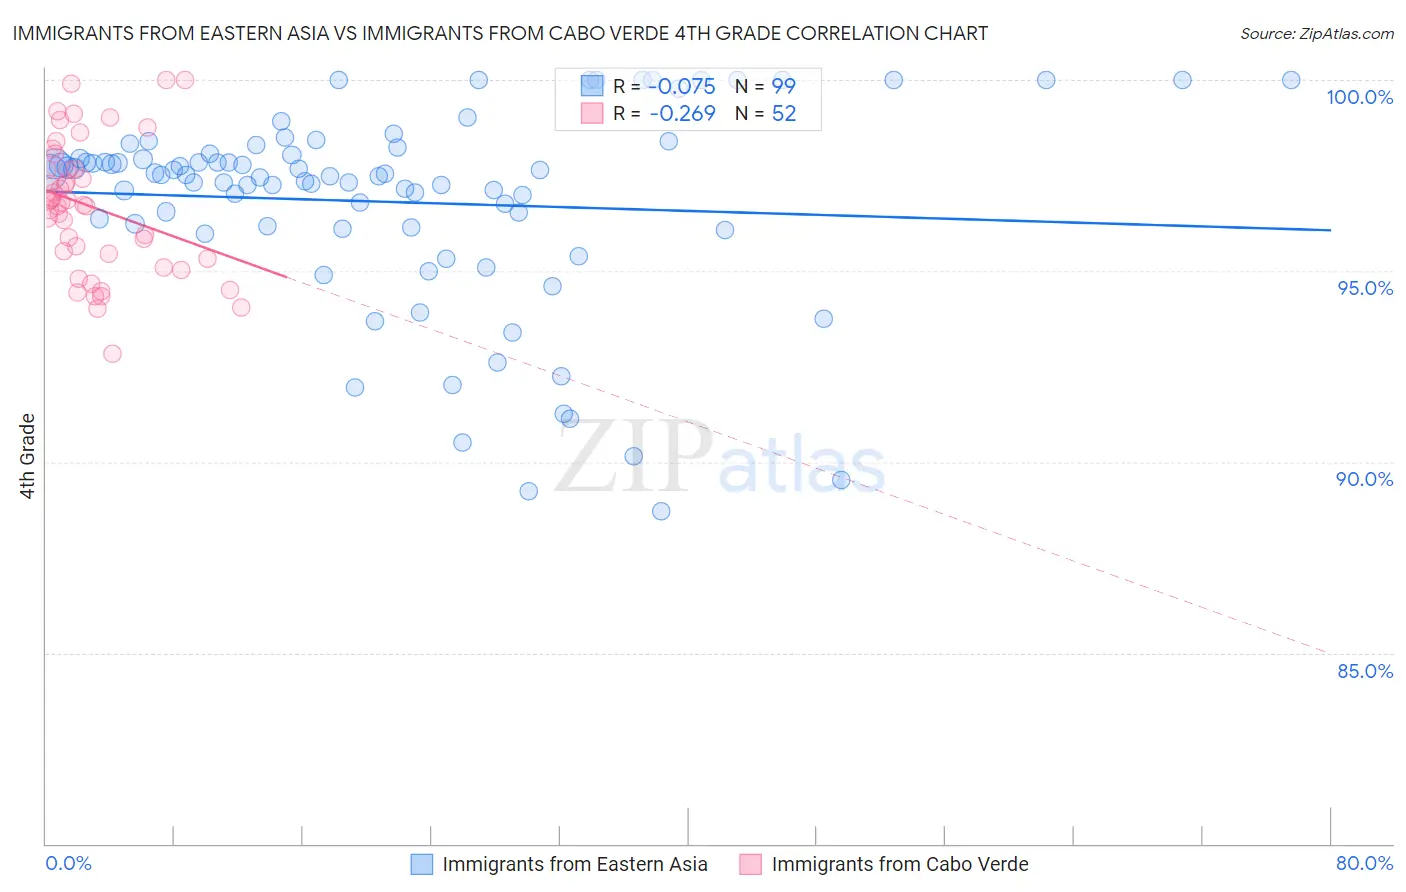
Immigrants from Eastern Asia vs Immigrants from Cabo Verde 4th Grade Correlation Chart
The statistical analysis conducted on geographies consisting of 499,865,893 people shows a slight negative correlation between the proportion of Immigrants from Eastern Asia and percentage of population with at least 4th grade education in the United States with a correlation coefficient (R) of -0.075 and weighted average of 97.2%. Similarly, the statistical analysis conducted on geographies consisting of 38,113,948 people shows a weak negative correlation between the proportion of Immigrants from Cabo Verde and percentage of population with at least 4th grade education in the United States with a correlation coefficient (R) of -0.269 and weighted average of 95.7%, a difference of 1.5%.
4th Grade Correlation Summary
| Measurement | Immigrants from Eastern Asia | Immigrants from Cabo Verde |
| Minimum | 88.7% | 92.8% |
| Maximum | 100.0% | 100.0% |
| Range | 11.3% | 7.2% |
| Mean | 96.8% | 96.7% |
| Median | 97.5% | 96.8% |
| Interquartile 25% (IQ1) | 96.1% | 95.4% |
| Interquartile 75% (IQ3) | 98.1% | 97.7% |
| Interquartile Range (IQR) | 2.0% | 2.3% |
| Standard Deviation (Sample) | 2.6% | 1.7% |
| Standard Deviation (Population) | 2.6% | 1.7% |
Similar Demographics by 4th Grade
Demographics Similar to Immigrants from Eastern Asia by 4th Grade
In terms of 4th grade, the demographic groups most similar to Immigrants from Eastern Asia are Senegalese (97.2%, a difference of 0.010%), Assyrian/Chaldean/Syriac (97.2%, a difference of 0.010%), Yuman (97.2%, a difference of 0.010%), Uruguayan (97.2%, a difference of 0.020%), and Immigrants from Malaysia (97.2%, a difference of 0.020%).
| Demographics | Rating | Rank | 4th Grade |
| Liberians | 3.6 /100 | #229 | Tragic 97.2% |
| Uruguayans | 3.5 /100 | #230 | Tragic 97.2% |
| Immigrants | Malaysia | 3.4 /100 | #231 | Tragic 97.2% |
| Immigrants | Western Asia | 3.4 /100 | #232 | Tragic 97.2% |
| Senegalese | 3.1 /100 | #233 | Tragic 97.2% |
| Assyrians/Chaldeans/Syriacs | 3.0 /100 | #234 | Tragic 97.2% |
| Yuman | 2.9 /100 | #235 | Tragic 97.2% |
| Immigrants | Eastern Asia | 2.7 /100 | #236 | Tragic 97.2% |
| Immigrants | Costa Rica | 2.0 /100 | #237 | Tragic 97.2% |
| Indians (Asian) | 1.9 /100 | #238 | Tragic 97.2% |
| Nigerians | 1.8 /100 | #239 | Tragic 97.1% |
| Colombians | 1.6 /100 | #240 | Tragic 97.1% |
| Immigrants | Indonesia | 1.5 /100 | #241 | Tragic 97.1% |
| Asians | 1.4 /100 | #242 | Tragic 97.1% |
| U.S. Virgin Islanders | 1.4 /100 | #243 | Tragic 97.1% |
Demographics Similar to Immigrants from Cabo Verde by 4th Grade
In terms of 4th grade, the demographic groups most similar to Immigrants from Cabo Verde are Immigrants from Dominican Republic (95.7%, a difference of 0.0%), Immigrants from Honduras (95.8%, a difference of 0.050%), Immigrants from Armenia (95.8%, a difference of 0.060%), Immigrants from Latin America (95.7%, a difference of 0.060%), and Immigrants from Cambodia (95.8%, a difference of 0.11%).
| Demographics | Rating | Rank | 4th Grade |
| Hondurans | 0.0 /100 | #327 | Tragic 96.0% |
| Mexican American Indians | 0.0 /100 | #328 | Tragic 95.8% |
| Immigrants | Cambodia | 0.0 /100 | #329 | Tragic 95.8% |
| Immigrants | Fiji | 0.0 /100 | #330 | Tragic 95.8% |
| Immigrants | Armenia | 0.0 /100 | #331 | Tragic 95.8% |
| Immigrants | Honduras | 0.0 /100 | #332 | Tragic 95.8% |
| Immigrants | Dominican Republic | 0.0 /100 | #333 | Tragic 95.7% |
| Immigrants | Cabo Verde | 0.0 /100 | #334 | Tragic 95.7% |
| Immigrants | Latin America | 0.0 /100 | #335 | Tragic 95.7% |
| Mexicans | 0.0 /100 | #336 | Tragic 95.6% |
| Central Americans | 0.0 /100 | #337 | Tragic 95.5% |
| Nepalese | 0.0 /100 | #338 | Tragic 95.5% |
| Guatemalans | 0.0 /100 | #339 | Tragic 95.3% |
| Yakama | 0.0 /100 | #340 | Tragic 95.2% |
| Immigrants | Yemen | 0.0 /100 | #341 | Tragic 95.2% |