Immigrants from Eastern Africa vs Navajo Master's Degree
COMPARE
Immigrants from Eastern Africa
Navajo
Master's Degree
Master's Degree Comparison
Immigrants from Eastern Africa
Navajo
16.3%
MASTER'S DEGREE
95.2/ 100
METRIC RATING
126th/ 347
METRIC RANK
9.4%
MASTER'S DEGREE
0.0/ 100
METRIC RATING
341st/ 347
METRIC RANK
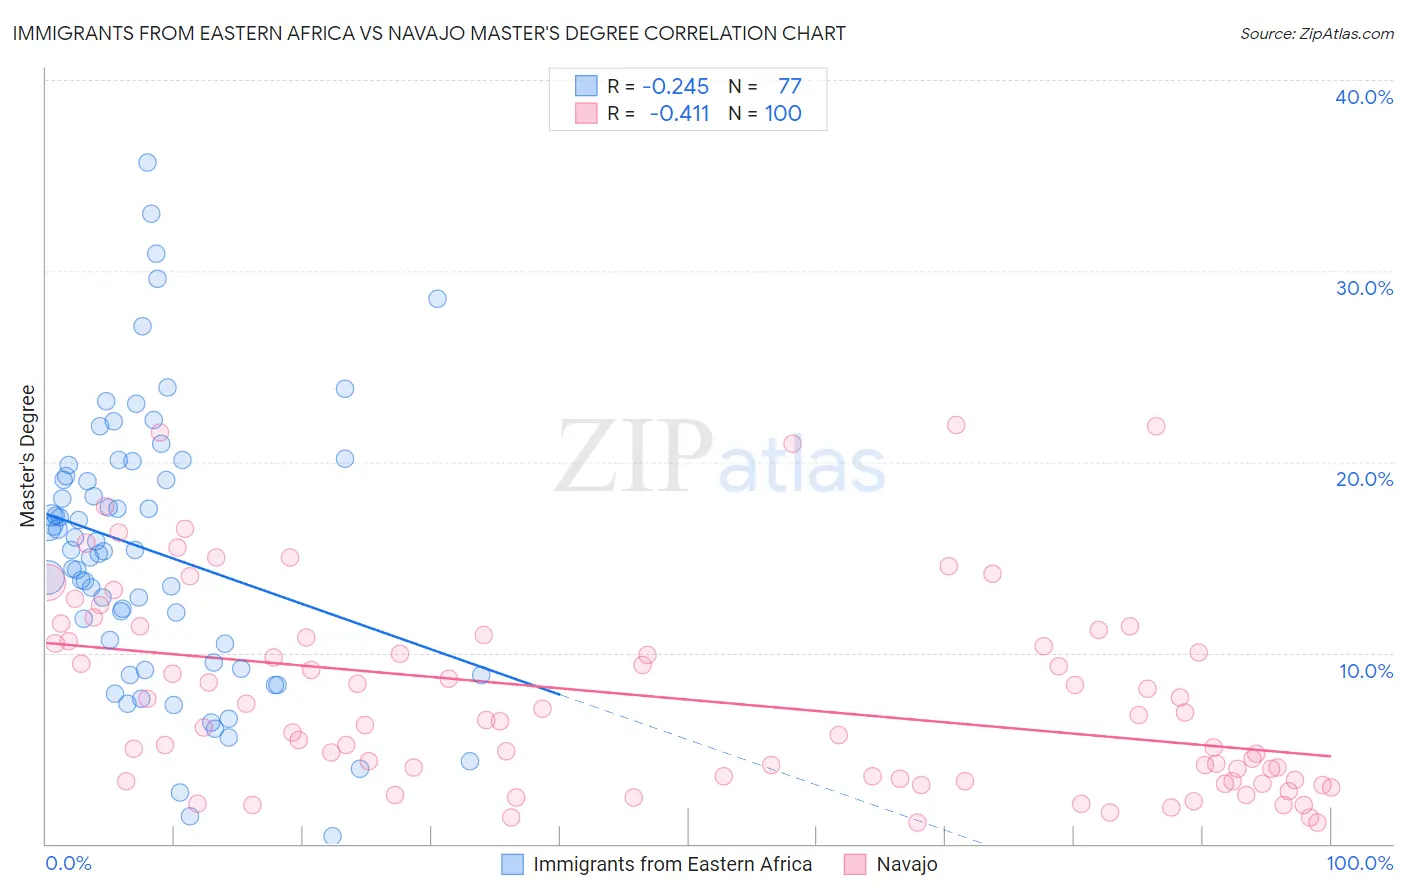
Immigrants from Eastern Africa vs Navajo Master's Degree Correlation Chart
The statistical analysis conducted on geographies consisting of 355,067,936 people shows a weak negative correlation between the proportion of Immigrants from Eastern Africa and percentage of population with at least master's degree education in the United States with a correlation coefficient (R) of -0.245 and weighted average of 16.3%. Similarly, the statistical analysis conducted on geographies consisting of 224,762,496 people shows a moderate negative correlation between the proportion of Navajo and percentage of population with at least master's degree education in the United States with a correlation coefficient (R) of -0.411 and weighted average of 9.4%, a difference of 73.4%.
Master's Degree Correlation Summary
| Measurement | Immigrants from Eastern Africa | Navajo |
| Minimum | 0.40% | 1.1% |
| Maximum | 35.7% | 22.0% |
| Range | 35.3% | 20.9% |
| Mean | 15.3% | 7.6% |
| Median | 15.4% | 6.3% |
| Interquartile 25% (IQ1) | 9.3% | 3.3% |
| Interquartile 75% (IQ3) | 19.6% | 10.7% |
| Interquartile Range (IQR) | 10.2% | 7.4% |
| Standard Deviation (Sample) | 7.2% | 5.2% |
| Standard Deviation (Population) | 7.2% | 5.1% |
Similar Demographics by Master's Degree
Demographics Similar to Immigrants from Eastern Africa by Master's Degree
In terms of master's degree, the demographic groups most similar to Immigrants from Eastern Africa are Italian (16.4%, a difference of 0.11%), Immigrants from Eritrea (16.4%, a difference of 0.19%), Croatian (16.4%, a difference of 0.26%), Palestinian (16.3%, a difference of 0.26%), and British (16.4%, a difference of 0.27%).
| Demographics | Rating | Rank | Master's Degree |
| Jordanians | 96.5 /100 | #119 | Exceptional 16.5% |
| Lebanese | 96.4 /100 | #120 | Exceptional 16.5% |
| Afghans | 96.2 /100 | #121 | Exceptional 16.5% |
| British | 95.6 /100 | #122 | Exceptional 16.4% |
| Croatians | 95.6 /100 | #123 | Exceptional 16.4% |
| Immigrants | Eritrea | 95.5 /100 | #124 | Exceptional 16.4% |
| Italians | 95.4 /100 | #125 | Exceptional 16.4% |
| Immigrants | Eastern Africa | 95.2 /100 | #126 | Exceptional 16.3% |
| Palestinians | 94.8 /100 | #127 | Exceptional 16.3% |
| Immigrants | Sierra Leone | 94.7 /100 | #128 | Exceptional 16.3% |
| Immigrants | Syria | 93.3 /100 | #129 | Exceptional 16.2% |
| Immigrants | Jordan | 92.7 /100 | #130 | Exceptional 16.1% |
| Taiwanese | 91.9 /100 | #131 | Exceptional 16.1% |
| Serbians | 91.7 /100 | #132 | Exceptional 16.1% |
| Immigrants | Sudan | 90.2 /100 | #133 | Exceptional 16.0% |
Demographics Similar to Navajo by Master's Degree
In terms of master's degree, the demographic groups most similar to Navajo are Yakama (9.5%, a difference of 0.35%), Immigrants from Mexico (9.3%, a difference of 1.3%), Spanish American Indian (9.6%, a difference of 1.6%), Lumbee (9.3%, a difference of 1.8%), and Pima (9.2%, a difference of 1.9%).
| Demographics | Rating | Rank | Master's Degree |
| Menominee | 0.0 /100 | #333 | Tragic 10.2% |
| Arapaho | 0.0 /100 | #334 | Tragic 10.0% |
| Immigrants | Central America | 0.0 /100 | #335 | Tragic 10.0% |
| Natives/Alaskans | 0.0 /100 | #336 | Tragic 9.9% |
| Mexicans | 0.0 /100 | #337 | Tragic 9.7% |
| Tohono O'odham | 0.0 /100 | #338 | Tragic 9.7% |
| Spanish American Indians | 0.0 /100 | #339 | Tragic 9.6% |
| Yakama | 0.0 /100 | #340 | Tragic 9.5% |
| Navajo | 0.0 /100 | #341 | Tragic 9.4% |
| Immigrants | Mexico | 0.0 /100 | #342 | Tragic 9.3% |
| Lumbee | 0.0 /100 | #343 | Tragic 9.3% |
| Pima | 0.0 /100 | #344 | Tragic 9.2% |
| Yuman | 0.0 /100 | #345 | Tragic 9.2% |
| Yup'ik | 0.0 /100 | #346 | Tragic 8.5% |
| Houma | 0.0 /100 | #347 | Tragic 7.9% |