Immigrants from Eastern Africa vs Mexican Associate's Degree
COMPARE
Immigrants from Eastern Africa
Mexican
Associate's Degree
Associate's Degree Comparison
Immigrants from Eastern Africa
Mexicans
48.4%
ASSOCIATE'S DEGREE
91.6/ 100
METRIC RATING
128th/ 347
METRIC RANK
35.0%
ASSOCIATE'S DEGREE
0.0/ 100
METRIC RATING
333rd/ 347
METRIC RANK
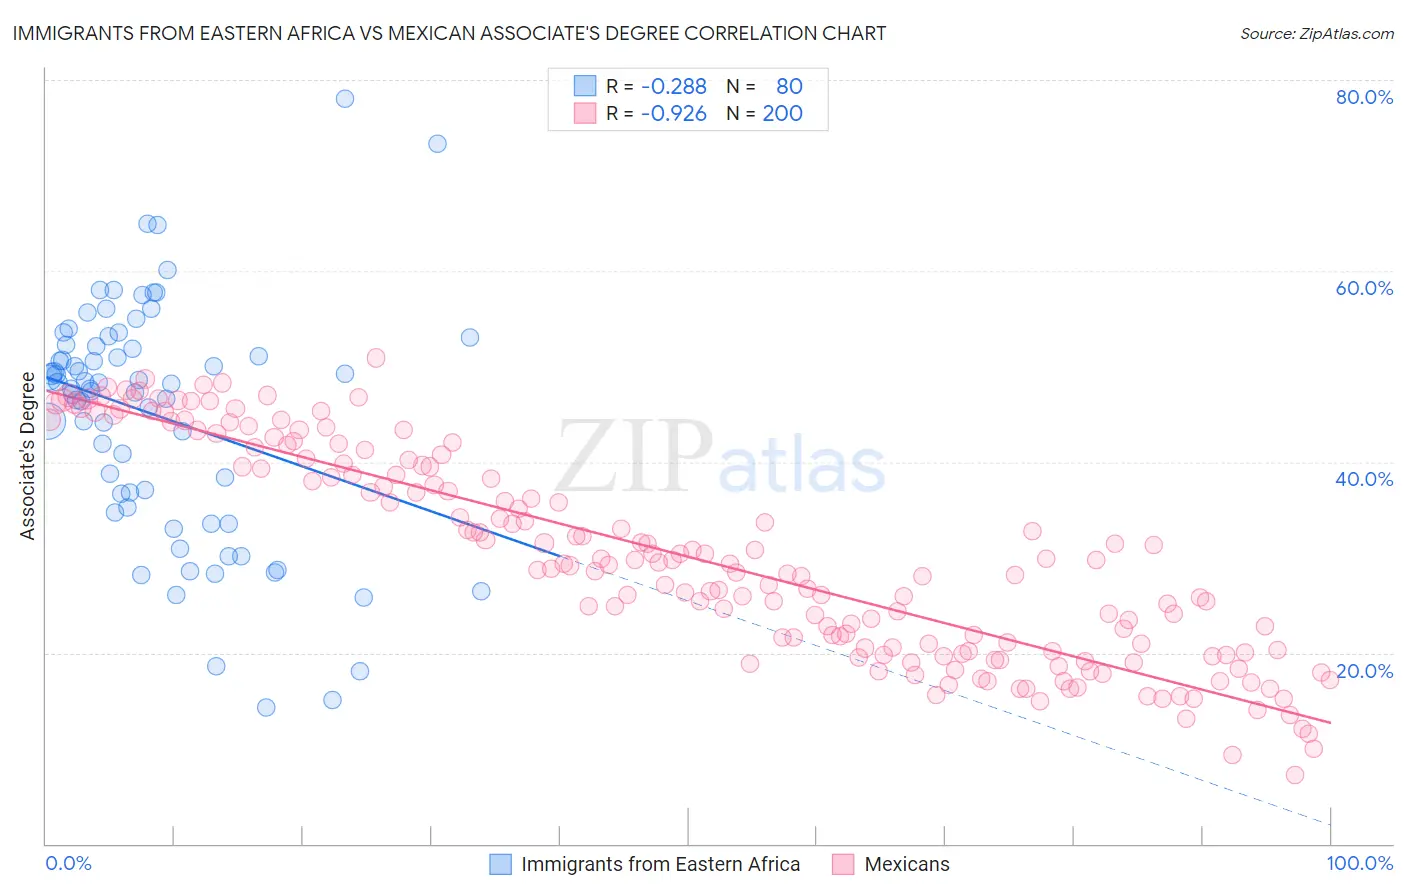
Immigrants from Eastern Africa vs Mexican Associate's Degree Correlation Chart
The statistical analysis conducted on geographies consisting of 355,139,091 people shows a weak negative correlation between the proportion of Immigrants from Eastern Africa and percentage of population with at least associate's degree education in the United States with a correlation coefficient (R) of -0.288 and weighted average of 48.4%. Similarly, the statistical analysis conducted on geographies consisting of 565,203,819 people shows a near-perfect negative correlation between the proportion of Mexicans and percentage of population with at least associate's degree education in the United States with a correlation coefficient (R) of -0.926 and weighted average of 35.0%, a difference of 38.4%.
Associate's Degree Correlation Summary
| Measurement | Immigrants from Eastern Africa | Mexican |
| Minimum | 14.3% | 7.3% |
| Maximum | 78.0% | 50.9% |
| Range | 63.7% | 43.6% |
| Mean | 44.8% | 30.0% |
| Median | 47.9% | 29.3% |
| Interquartile 25% (IQ1) | 35.9% | 20.2% |
| Interquartile 75% (IQ3) | 52.2% | 39.7% |
| Interquartile Range (IQR) | 16.2% | 19.5% |
| Standard Deviation (Sample) | 12.5% | 10.9% |
| Standard Deviation (Population) | 12.4% | 10.9% |
Similar Demographics by Associate's Degree
Demographics Similar to Immigrants from Eastern Africa by Associate's Degree
In terms of associate's degree, the demographic groups most similar to Immigrants from Eastern Africa are Swedish (48.4%, a difference of 0.030%), Immigrants from Jordan (48.4%, a difference of 0.090%), Immigrants from Uganda (48.5%, a difference of 0.12%), Immigrants from Syria (48.5%, a difference of 0.13%), and Icelander (48.3%, a difference of 0.19%).
| Demographics | Rating | Rank | Associate's Degree |
| Ugandans | 93.9 /100 | #121 | Exceptional 48.7% |
| Italians | 93.9 /100 | #122 | Exceptional 48.7% |
| Brazilians | 93.7 /100 | #123 | Exceptional 48.7% |
| Serbians | 92.6 /100 | #124 | Exceptional 48.5% |
| Chinese | 92.5 /100 | #125 | Exceptional 48.5% |
| Immigrants | Syria | 92.2 /100 | #126 | Exceptional 48.5% |
| Immigrants | Uganda | 92.1 /100 | #127 | Exceptional 48.5% |
| Immigrants | Eastern Africa | 91.6 /100 | #128 | Exceptional 48.4% |
| Swedes | 91.5 /100 | #129 | Exceptional 48.4% |
| Immigrants | Jordan | 91.2 /100 | #130 | Exceptional 48.4% |
| Icelanders | 90.8 /100 | #131 | Exceptional 48.3% |
| Immigrants | Albania | 89.9 /100 | #132 | Excellent 48.2% |
| Assyrians/Chaldeans/Syriacs | 89.4 /100 | #133 | Excellent 48.2% |
| Moroccans | 89.3 /100 | #134 | Excellent 48.2% |
| Europeans | 89.0 /100 | #135 | Excellent 48.2% |
Demographics Similar to Mexicans by Associate's Degree
In terms of associate's degree, the demographic groups most similar to Mexicans are Immigrants from Central America (35.0%, a difference of 0.080%), Native/Alaskan (34.9%, a difference of 0.24%), Spanish American Indian (34.9%, a difference of 0.37%), Hopi (34.6%, a difference of 1.3%), and Immigrants from the Azores (35.6%, a difference of 1.9%).
| Demographics | Rating | Rank | Associate's Degree |
| Kiowa | 0.0 /100 | #326 | Tragic 36.5% |
| Dutch West Indians | 0.0 /100 | #327 | Tragic 36.5% |
| Alaskan Athabascans | 0.0 /100 | #328 | Tragic 36.5% |
| Paiute | 0.0 /100 | #329 | Tragic 36.4% |
| Apache | 0.0 /100 | #330 | Tragic 36.2% |
| Immigrants | Azores | 0.0 /100 | #331 | Tragic 35.6% |
| Immigrants | Central America | 0.0 /100 | #332 | Tragic 35.0% |
| Mexicans | 0.0 /100 | #333 | Tragic 35.0% |
| Natives/Alaskans | 0.0 /100 | #334 | Tragic 34.9% |
| Spanish American Indians | 0.0 /100 | #335 | Tragic 34.9% |
| Hopi | 0.0 /100 | #336 | Tragic 34.6% |
| Lumbee | 0.0 /100 | #337 | Tragic 34.1% |
| Pueblo | 0.0 /100 | #338 | Tragic 34.0% |
| Immigrants | Mexico | 0.0 /100 | #339 | Tragic 33.7% |
| Navajo | 0.0 /100 | #340 | Tragic 32.6% |