Eastern European vs Mexican Associate's Degree
COMPARE
Eastern European
Mexican
Associate's Degree
Associate's Degree Comparison
Eastern Europeans
Mexicans
55.0%
ASSOCIATE'S DEGREE
100.0/ 100
METRIC RATING
17th/ 347
METRIC RANK
35.0%
ASSOCIATE'S DEGREE
0.0/ 100
METRIC RATING
333rd/ 347
METRIC RANK
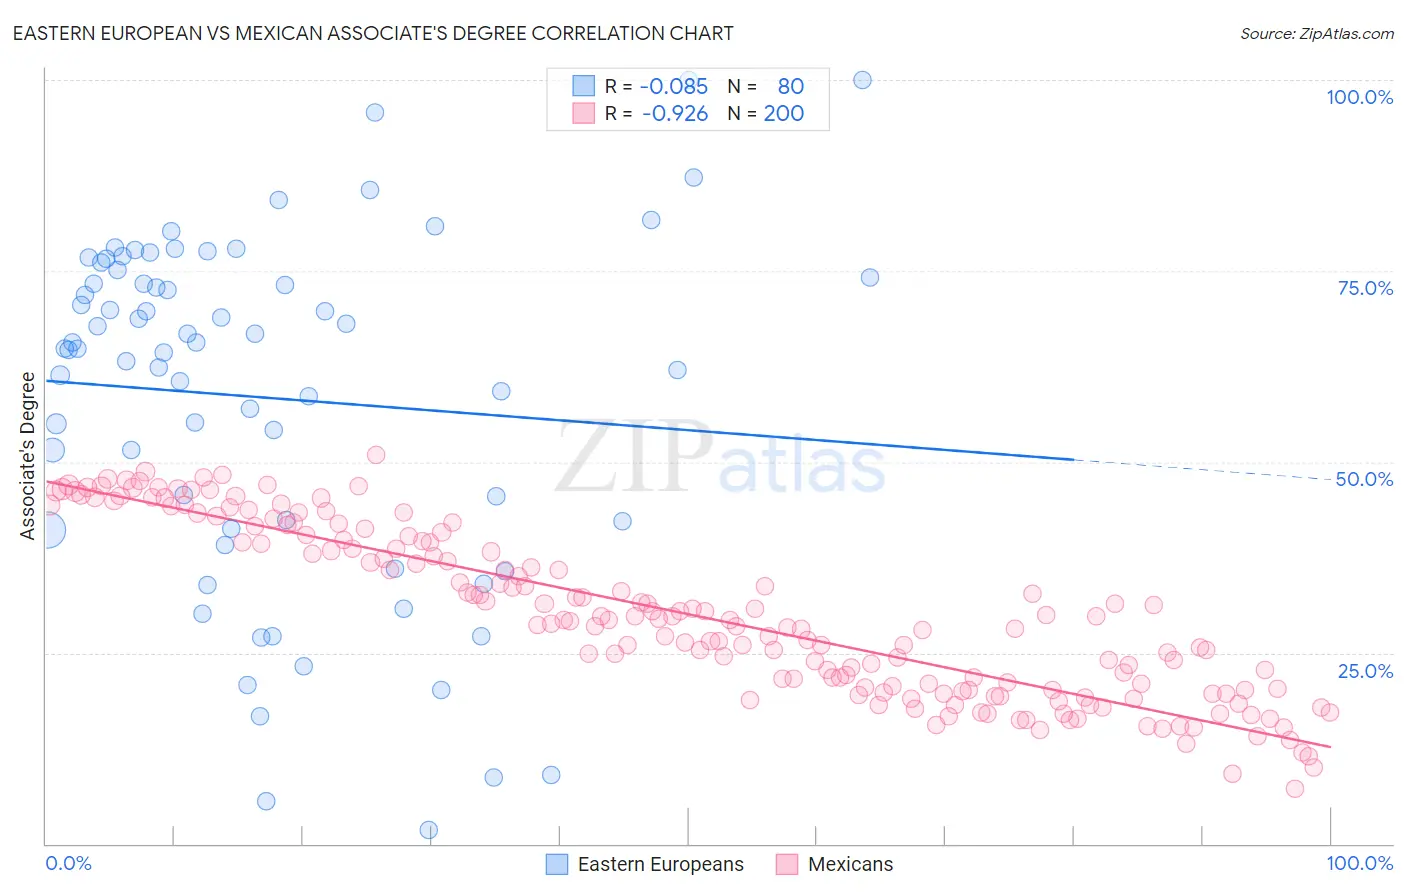
Eastern European vs Mexican Associate's Degree Correlation Chart
The statistical analysis conducted on geographies consisting of 461,211,672 people shows a slight negative correlation between the proportion of Eastern Europeans and percentage of population with at least associate's degree education in the United States with a correlation coefficient (R) of -0.085 and weighted average of 55.0%. Similarly, the statistical analysis conducted on geographies consisting of 565,203,819 people shows a near-perfect negative correlation between the proportion of Mexicans and percentage of population with at least associate's degree education in the United States with a correlation coefficient (R) of -0.926 and weighted average of 35.0%, a difference of 57.3%.
Associate's Degree Correlation Summary
| Measurement | Eastern European | Mexican |
| Minimum | 1.8% | 7.3% |
| Maximum | 100.0% | 50.9% |
| Range | 98.2% | 43.6% |
| Mean | 58.3% | 30.0% |
| Median | 64.8% | 29.3% |
| Interquartile 25% (IQ1) | 41.8% | 20.2% |
| Interquartile 75% (IQ3) | 74.6% | 39.7% |
| Interquartile Range (IQR) | 32.9% | 19.5% |
| Standard Deviation (Sample) | 22.7% | 10.9% |
| Standard Deviation (Population) | 22.6% | 10.9% |
Similar Demographics by Associate's Degree
Demographics Similar to Eastern Europeans by Associate's Degree
In terms of associate's degree, the demographic groups most similar to Eastern Europeans are Soviet Union (55.1%, a difference of 0.14%), Indian (Asian) (54.8%, a difference of 0.48%), Immigrants from Eastern Asia (55.4%, a difference of 0.61%), Immigrants from Hong Kong (55.4%, a difference of 0.64%), and Immigrants from Ireland (54.7%, a difference of 0.70%).
| Demographics | Rating | Rank | Associate's Degree |
| Cypriots | 100.0 /100 | #10 | Exceptional 56.4% |
| Immigrants | Australia | 100.0 /100 | #11 | Exceptional 55.8% |
| Immigrants | South Central Asia | 100.0 /100 | #12 | Exceptional 55.7% |
| Immigrants | China | 100.0 /100 | #13 | Exceptional 55.5% |
| Immigrants | Hong Kong | 100.0 /100 | #14 | Exceptional 55.4% |
| Immigrants | Eastern Asia | 100.0 /100 | #15 | Exceptional 55.4% |
| Soviet Union | 100.0 /100 | #16 | Exceptional 55.1% |
| Eastern Europeans | 100.0 /100 | #17 | Exceptional 55.0% |
| Indians (Asian) | 100.0 /100 | #18 | Exceptional 54.8% |
| Immigrants | Ireland | 100.0 /100 | #19 | Exceptional 54.7% |
| Cambodians | 100.0 /100 | #20 | Exceptional 54.6% |
| Immigrants | Sweden | 100.0 /100 | #21 | Exceptional 54.6% |
| Immigrants | Japan | 100.0 /100 | #22 | Exceptional 54.6% |
| Burmese | 100.0 /100 | #23 | Exceptional 54.6% |
| Immigrants | Korea | 100.0 /100 | #24 | Exceptional 54.5% |
Demographics Similar to Mexicans by Associate's Degree
In terms of associate's degree, the demographic groups most similar to Mexicans are Immigrants from Central America (35.0%, a difference of 0.080%), Native/Alaskan (34.9%, a difference of 0.24%), Spanish American Indian (34.9%, a difference of 0.37%), Hopi (34.6%, a difference of 1.3%), and Immigrants from the Azores (35.6%, a difference of 1.9%).
| Demographics | Rating | Rank | Associate's Degree |
| Kiowa | 0.0 /100 | #326 | Tragic 36.5% |
| Dutch West Indians | 0.0 /100 | #327 | Tragic 36.5% |
| Alaskan Athabascans | 0.0 /100 | #328 | Tragic 36.5% |
| Paiute | 0.0 /100 | #329 | Tragic 36.4% |
| Apache | 0.0 /100 | #330 | Tragic 36.2% |
| Immigrants | Azores | 0.0 /100 | #331 | Tragic 35.6% |
| Immigrants | Central America | 0.0 /100 | #332 | Tragic 35.0% |
| Mexicans | 0.0 /100 | #333 | Tragic 35.0% |
| Natives/Alaskans | 0.0 /100 | #334 | Tragic 34.9% |
| Spanish American Indians | 0.0 /100 | #335 | Tragic 34.9% |
| Hopi | 0.0 /100 | #336 | Tragic 34.6% |
| Lumbee | 0.0 /100 | #337 | Tragic 34.1% |
| Pueblo | 0.0 /100 | #338 | Tragic 34.0% |
| Immigrants | Mexico | 0.0 /100 | #339 | Tragic 33.7% |
| Navajo | 0.0 /100 | #340 | Tragic 32.6% |