Immigrants from China vs Osage 12th Grade, No Diploma
COMPARE
Immigrants from China
Osage
12th Grade, No Diploma
12th Grade, No Diploma Comparison
Immigrants from China
Osage
91.3%
12TH GRADE, NO DIPLOMA
60.9/ 100
METRIC RATING
164th/ 347
METRIC RANK
91.0%
12TH GRADE, NO DIPLOMA
38.3/ 100
METRIC RATING
183rd/ 347
METRIC RANK
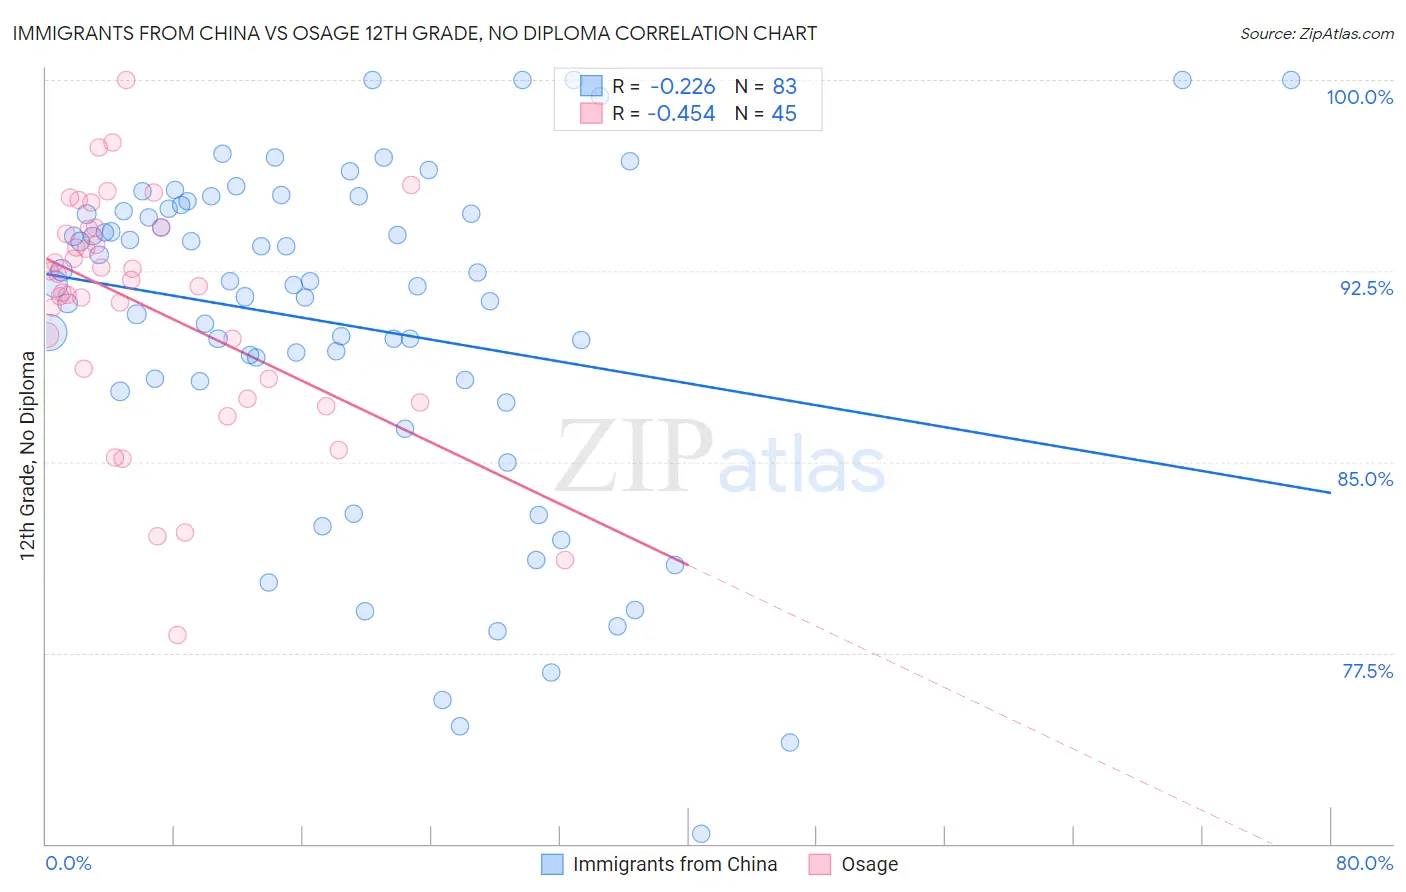
Immigrants from China vs Osage 12th Grade, No Diploma Correlation Chart
The statistical analysis conducted on geographies consisting of 457,082,916 people shows a weak negative correlation between the proportion of Immigrants from China and percentage of population with at least 12th grade (no diploma) education in the United States with a correlation coefficient (R) of -0.226 and weighted average of 91.3%. Similarly, the statistical analysis conducted on geographies consisting of 91,808,929 people shows a moderate negative correlation between the proportion of Osage and percentage of population with at least 12th grade (no diploma) education in the United States with a correlation coefficient (R) of -0.454 and weighted average of 91.0%, a difference of 0.28%.
12th Grade, No Diploma Correlation Summary
| Measurement | Immigrants from China | Osage |
| Minimum | 70.4% | 78.2% |
| Maximum | 100.0% | 100.0% |
| Range | 29.6% | 21.8% |
| Mean | 90.4% | 91.1% |
| Median | 92.0% | 92.1% |
| Interquartile 25% (IQ1) | 88.2% | 87.9% |
| Interquartile 75% (IQ3) | 95.0% | 94.2% |
| Interquartile Range (IQR) | 6.8% | 6.3% |
| Standard Deviation (Sample) | 6.7% | 4.7% |
| Standard Deviation (Population) | 6.7% | 4.6% |
Demographics Similar to Immigrants from China and Osage by 12th Grade, No Diploma
In terms of 12th grade, no diploma, the demographic groups most similar to Immigrants from China are Immigrants from Asia (91.3%, a difference of 0.010%), Alsatian (91.3%, a difference of 0.030%), Hmong (91.3%, a difference of 0.040%), Immigrants from Malaysia (91.3%, a difference of 0.040%), and Cree (91.2%, a difference of 0.050%). Similarly, the demographic groups most similar to Osage are Nonimmigrants (91.0%, a difference of 0.010%), Immigrants from Syria (91.1%, a difference of 0.020%), Guamanian/Chamorro (91.0%, a difference of 0.020%), Immigrants from Chile (91.1%, a difference of 0.060%), and Spanish (91.1%, a difference of 0.070%).
| Demographics | Rating | Rank | 12th Grade, No Diploma |
| Immigrants | Asia | 61.5 /100 | #163 | Good 91.3% |
| Immigrants | China | 60.9 /100 | #164 | Good 91.3% |
| Alsatians | 58.3 /100 | #165 | Average 91.3% |
| Hmong | 58.0 /100 | #166 | Average 91.3% |
| Immigrants | Malaysia | 57.8 /100 | #167 | Average 91.3% |
| Cree | 57.0 /100 | #168 | Average 91.2% |
| Immigrants | Indonesia | 54.9 /100 | #169 | Average 91.2% |
| Delaware | 52.8 /100 | #170 | Average 91.2% |
| Immigrants | Morocco | 51.4 /100 | #171 | Average 91.2% |
| Bermudans | 50.8 /100 | #172 | Average 91.2% |
| Bolivians | 50.4 /100 | #173 | Average 91.2% |
| Immigrants | Nepal | 50.0 /100 | #174 | Average 91.2% |
| Immigrants | Western Asia | 49.0 /100 | #175 | Average 91.2% |
| Iroquois | 48.5 /100 | #176 | Average 91.1% |
| Sierra Leoneans | 47.7 /100 | #177 | Average 91.1% |
| Spanish | 43.7 /100 | #178 | Average 91.1% |
| Immigrants | Chile | 43.3 /100 | #179 | Average 91.1% |
| Immigrants | Syria | 40.3 /100 | #180 | Average 91.1% |
| Guamanians/Chamorros | 39.5 /100 | #181 | Fair 91.0% |
| Immigrants | Nonimmigrants | 38.8 /100 | #182 | Fair 91.0% |
| Osage | 38.3 /100 | #183 | Fair 91.0% |