Immigrants from Burma/Myanmar vs Jordanian 6th Grade
COMPARE
Immigrants from Burma/Myanmar
Jordanian
6th Grade
6th Grade Comparison
Immigrants from Burma/Myanmar
Jordanians
95.7%
6TH GRADE
0.0/ 100
METRIC RATING
302nd/ 347
METRIC RANK
97.2%
6TH GRADE
84.6/ 100
METRIC RATING
142nd/ 347
METRIC RANK
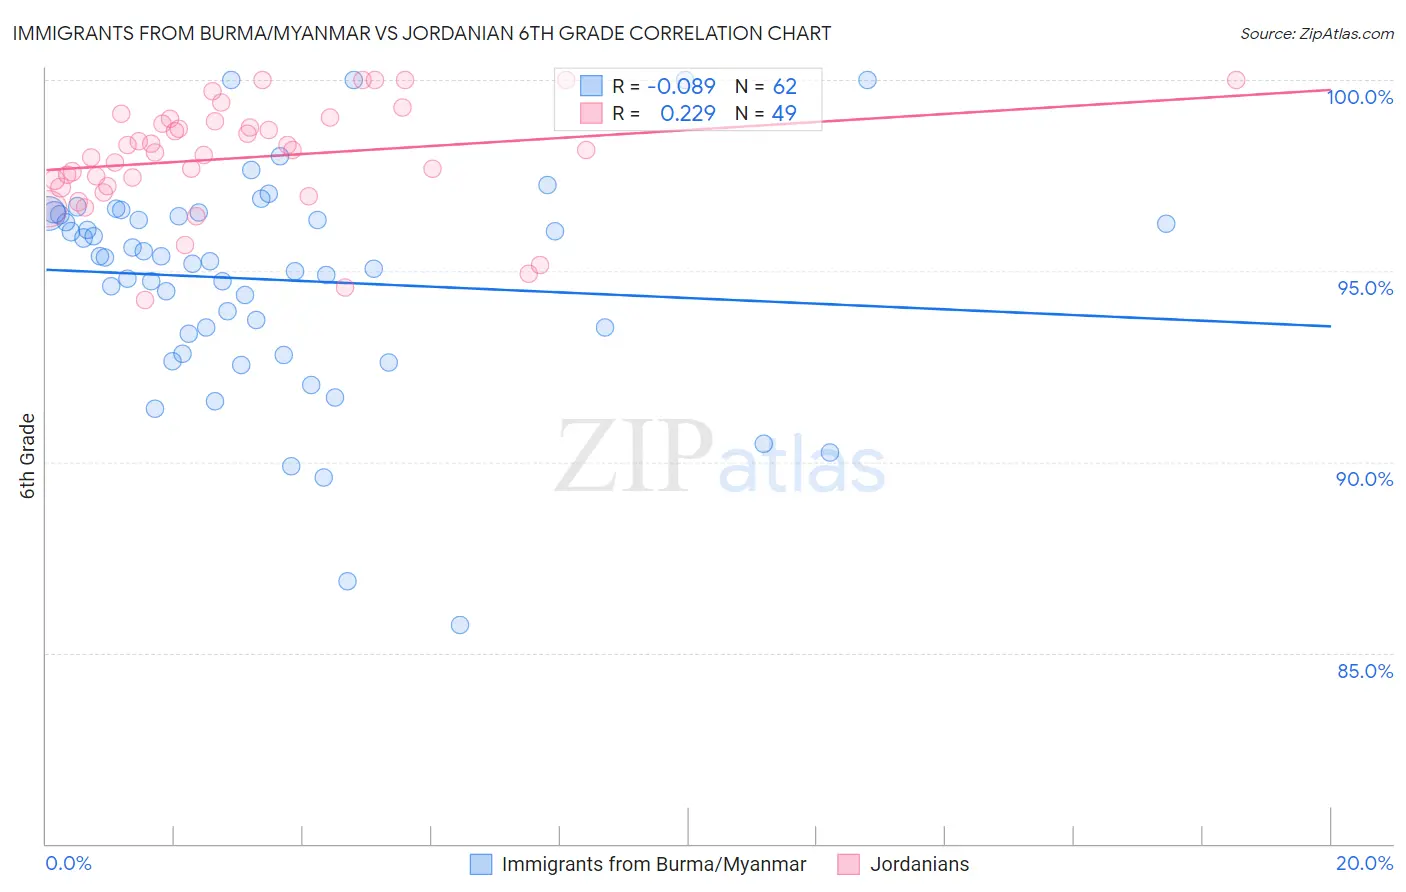
Immigrants from Burma/Myanmar vs Jordanian 6th Grade Correlation Chart
The statistical analysis conducted on geographies consisting of 172,326,083 people shows a slight negative correlation between the proportion of Immigrants from Burma/Myanmar and percentage of population with at least 6th grade education in the United States with a correlation coefficient (R) of -0.089 and weighted average of 95.7%. Similarly, the statistical analysis conducted on geographies consisting of 166,424,117 people shows a weak positive correlation between the proportion of Jordanians and percentage of population with at least 6th grade education in the United States with a correlation coefficient (R) of 0.229 and weighted average of 97.2%, a difference of 1.6%.
6th Grade Correlation Summary
| Measurement | Immigrants from Burma/Myanmar | Jordanian |
| Minimum | 85.7% | 94.2% |
| Maximum | 100.0% | 100.0% |
| Range | 14.3% | 5.8% |
| Mean | 94.8% | 98.0% |
| Median | 95.3% | 98.2% |
| Interquartile 25% (IQ1) | 93.4% | 97.2% |
| Interquartile 75% (IQ3) | 96.5% | 99.0% |
| Interquartile Range (IQR) | 3.1% | 1.7% |
| Standard Deviation (Sample) | 2.8% | 1.4% |
| Standard Deviation (Population) | 2.8% | 1.4% |
Similar Demographics by 6th Grade
Demographics Similar to Immigrants from Burma/Myanmar by 6th Grade
In terms of 6th grade, the demographic groups most similar to Immigrants from Burma/Myanmar are Immigrants from Dominica (95.7%, a difference of 0.020%), Immigrants (95.7%, a difference of 0.020%), Immigrants from Laos (95.7%, a difference of 0.030%), Sri Lankan (95.8%, a difference of 0.050%), and Bangladeshi (95.7%, a difference of 0.070%).
| Demographics | Rating | Rank | 6th Grade |
| Immigrants | Grenada | 0.0 /100 | #295 | Tragic 95.9% |
| Immigrants | South Eastern Asia | 0.0 /100 | #296 | Tragic 95.9% |
| Haitians | 0.0 /100 | #297 | Tragic 95.8% |
| Sri Lankans | 0.0 /100 | #298 | Tragic 95.8% |
| Immigrants | Laos | 0.0 /100 | #299 | Tragic 95.7% |
| Immigrants | Dominica | 0.0 /100 | #300 | Tragic 95.7% |
| Immigrants | Immigrants | 0.0 /100 | #301 | Tragic 95.7% |
| Immigrants | Burma/Myanmar | 0.0 /100 | #302 | Tragic 95.7% |
| Bangladeshis | 0.0 /100 | #303 | Tragic 95.7% |
| Indonesians | 0.0 /100 | #304 | Tragic 95.6% |
| Immigrants | Cuba | 0.0 /100 | #305 | Tragic 95.6% |
| Immigrants | Haiti | 0.0 /100 | #306 | Tragic 95.6% |
| Guyanese | 0.0 /100 | #307 | Tragic 95.6% |
| Immigrants | Caribbean | 0.0 /100 | #308 | Tragic 95.6% |
| Puerto Ricans | 0.0 /100 | #309 | Tragic 95.5% |
Demographics Similar to Jordanians by 6th Grade
In terms of 6th grade, the demographic groups most similar to Jordanians are Seminole (97.2%, a difference of 0.0%), Immigrants from Turkey (97.3%, a difference of 0.010%), Immigrants from North Macedonia (97.2%, a difference of 0.010%), Pima (97.2%, a difference of 0.010%), and Israeli (97.2%, a difference of 0.010%).
| Demographics | Rating | Rank | 6th Grade |
| Immigrants | Hungary | 89.5 /100 | #135 | Excellent 97.3% |
| Filipinos | 88.9 /100 | #136 | Excellent 97.3% |
| Burmese | 87.8 /100 | #137 | Excellent 97.3% |
| Blackfeet | 87.7 /100 | #138 | Excellent 97.3% |
| Immigrants | Turkey | 86.1 /100 | #139 | Excellent 97.3% |
| Immigrants | North Macedonia | 85.5 /100 | #140 | Excellent 97.2% |
| Seminole | 84.8 /100 | #141 | Excellent 97.2% |
| Jordanians | 84.6 /100 | #142 | Excellent 97.2% |
| Pima | 82.9 /100 | #143 | Excellent 97.2% |
| Israelis | 82.9 /100 | #144 | Excellent 97.2% |
| Spaniards | 80.1 /100 | #145 | Excellent 97.2% |
| Hopi | 78.8 /100 | #146 | Good 97.2% |
| Immigrants | South Central Asia | 78.1 /100 | #147 | Good 97.2% |
| Immigrants | Greece | 77.8 /100 | #148 | Good 97.2% |
| Immigrants | Israel | 76.0 /100 | #149 | Good 97.2% |