Immigrants from Bulgaria vs Guyanese 7th Grade
COMPARE
Immigrants from Bulgaria
Guyanese
7th Grade
7th Grade Comparison
Immigrants from Bulgaria
Guyanese
96.4%
7TH GRADE
94.0/ 100
METRIC RATING
125th/ 347
METRIC RANK
94.3%
7TH GRADE
0.0/ 100
METRIC RATING
305th/ 347
METRIC RANK
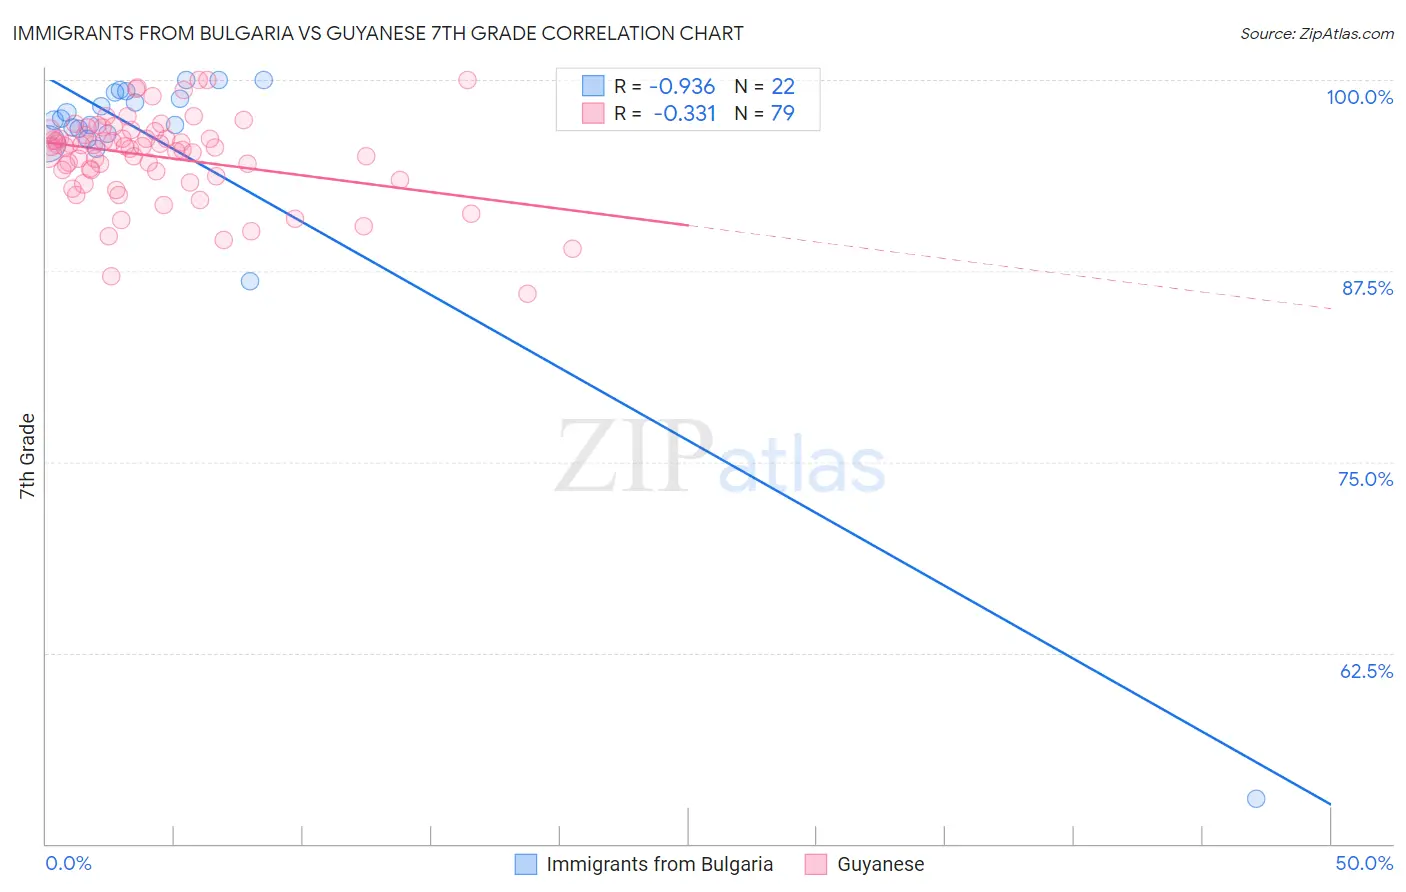
Immigrants from Bulgaria vs Guyanese 7th Grade Correlation Chart
The statistical analysis conducted on geographies consisting of 172,552,181 people shows a near-perfect negative correlation between the proportion of Immigrants from Bulgaria and percentage of population with at least 7th grade education in the United States with a correlation coefficient (R) of -0.936 and weighted average of 96.4%. Similarly, the statistical analysis conducted on geographies consisting of 176,937,226 people shows a mild negative correlation between the proportion of Guyanese and percentage of population with at least 7th grade education in the United States with a correlation coefficient (R) of -0.331 and weighted average of 94.3%, a difference of 2.2%.
7th Grade Correlation Summary
| Measurement | Immigrants from Bulgaria | Guyanese |
| Minimum | 52.9% | 86.0% |
| Maximum | 100.0% | 100.0% |
| Range | 47.1% | 14.0% |
| Mean | 95.4% | 95.0% |
| Median | 97.4% | 95.6% |
| Interquartile 25% (IQ1) | 96.5% | 93.7% |
| Interquartile 75% (IQ3) | 99.2% | 96.6% |
| Interquartile Range (IQR) | 2.7% | 2.9% |
| Standard Deviation (Sample) | 9.9% | 2.8% |
| Standard Deviation (Population) | 9.6% | 2.8% |
Similar Demographics by 7th Grade
Demographics Similar to Immigrants from Bulgaria by 7th Grade
In terms of 7th grade, the demographic groups most similar to Immigrants from Bulgaria are Immigrants from Switzerland (96.5%, a difference of 0.010%), Palestinian (96.4%, a difference of 0.010%), Immigrants from Europe (96.5%, a difference of 0.020%), Immigrants from France (96.5%, a difference of 0.020%), and Immigrants from Bosnia and Herzegovina (96.4%, a difference of 0.020%).
| Demographics | Rating | Rank | 7th Grade |
| Immigrants | Japan | 95.5 /100 | #118 | Exceptional 96.5% |
| Immigrants | Norway | 95.2 /100 | #119 | Exceptional 96.5% |
| Immigrants | Croatia | 95.0 /100 | #120 | Exceptional 96.5% |
| Cheyenne | 94.9 /100 | #121 | Exceptional 96.5% |
| Immigrants | Europe | 94.8 /100 | #122 | Exceptional 96.5% |
| Immigrants | France | 94.7 /100 | #123 | Exceptional 96.5% |
| Immigrants | Switzerland | 94.5 /100 | #124 | Exceptional 96.5% |
| Immigrants | Bulgaria | 94.0 /100 | #125 | Exceptional 96.4% |
| Palestinians | 93.5 /100 | #126 | Exceptional 96.4% |
| Immigrants | Bosnia and Herzegovina | 93.3 /100 | #127 | Exceptional 96.4% |
| Immigrants | Romania | 93.2 /100 | #128 | Exceptional 96.4% |
| Immigrants | North Macedonia | 93.1 /100 | #129 | Exceptional 96.4% |
| Immigrants | Serbia | 92.8 /100 | #130 | Exceptional 96.4% |
| Filipinos | 92.1 /100 | #131 | Exceptional 96.4% |
| Colville | 91.7 /100 | #132 | Exceptional 96.4% |
Demographics Similar to Guyanese by 7th Grade
In terms of 7th grade, the demographic groups most similar to Guyanese are Immigrants from Haiti (94.3%, a difference of 0.020%), Sri Lankan (94.4%, a difference of 0.060%), Immigrants from Guyana (94.2%, a difference of 0.13%), Immigrants from Dominica (94.5%, a difference of 0.14%), and Immigrants from Laos (94.5%, a difference of 0.14%).
| Demographics | Rating | Rank | 7th Grade |
| Indonesians | 0.0 /100 | #298 | Tragic 94.5% |
| Bangladeshis | 0.0 /100 | #299 | Tragic 94.5% |
| Immigrants | Burma/Myanmar | 0.0 /100 | #300 | Tragic 94.5% |
| Immigrants | Dominica | 0.0 /100 | #301 | Tragic 94.5% |
| Immigrants | Laos | 0.0 /100 | #302 | Tragic 94.5% |
| Sri Lankans | 0.0 /100 | #303 | Tragic 94.4% |
| Immigrants | Haiti | 0.0 /100 | #304 | Tragic 94.3% |
| Guyanese | 0.0 /100 | #305 | Tragic 94.3% |
| Immigrants | Guyana | 0.0 /100 | #306 | Tragic 94.2% |
| Immigrants | Portugal | 0.0 /100 | #307 | Tragic 94.2% |
| Cape Verdeans | 0.0 /100 | #308 | Tragic 94.1% |
| Ecuadorians | 0.0 /100 | #309 | Tragic 94.0% |
| Immigrants | Caribbean | 0.0 /100 | #310 | Tragic 94.0% |
| Puerto Ricans | 0.0 /100 | #311 | Tragic 94.0% |
| Immigrants | Immigrants | 0.0 /100 | #312 | Tragic 94.0% |