Immigrants from Bulgaria vs American 7th Grade
COMPARE
Immigrants from Bulgaria
American
7th Grade
7th Grade Comparison
Immigrants from Bulgaria
Americans
96.4%
7TH GRADE
94.0/ 100
METRIC RATING
125th/ 347
METRIC RANK
97.0%
7TH GRADE
99.8/ 100
METRIC RATING
57th/ 347
METRIC RANK
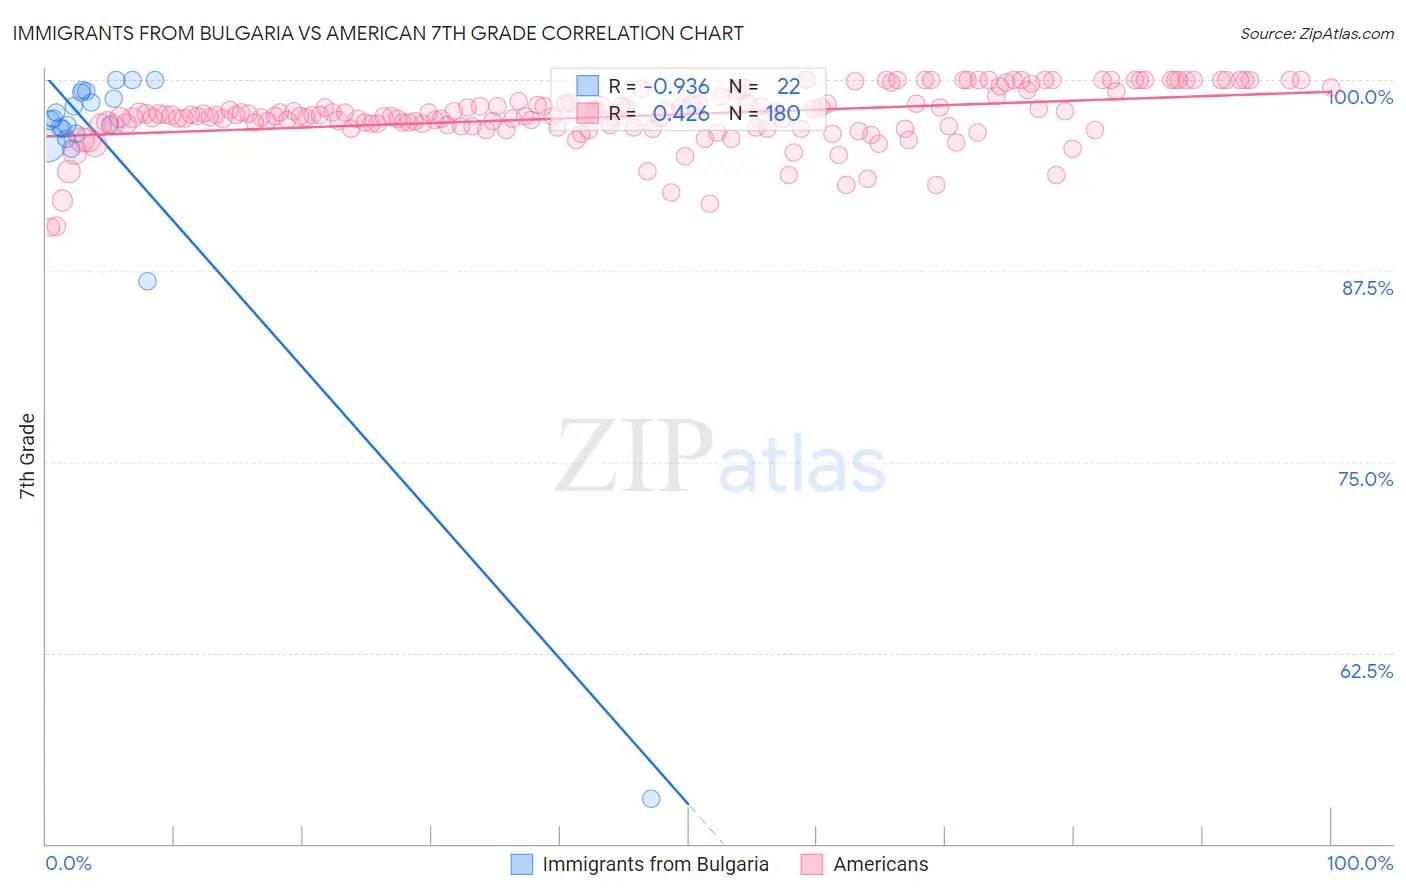
Immigrants from Bulgaria vs American 7th Grade Correlation Chart
The statistical analysis conducted on geographies consisting of 172,552,181 people shows a near-perfect negative correlation between the proportion of Immigrants from Bulgaria and percentage of population with at least 7th grade education in the United States with a correlation coefficient (R) of -0.936 and weighted average of 96.4%. Similarly, the statistical analysis conducted on geographies consisting of 581,993,989 people shows a moderate positive correlation between the proportion of Americans and percentage of population with at least 7th grade education in the United States with a correlation coefficient (R) of 0.426 and weighted average of 97.0%, a difference of 0.54%.
7th Grade Correlation Summary
| Measurement | Immigrants from Bulgaria | American |
| Minimum | 52.9% | 90.4% |
| Maximum | 100.0% | 100.0% |
| Range | 47.1% | 9.6% |
| Mean | 95.4% | 97.6% |
| Median | 97.4% | 97.7% |
| Interquartile 25% (IQ1) | 96.5% | 97.0% |
| Interquartile 75% (IQ3) | 99.2% | 98.5% |
| Interquartile Range (IQR) | 2.7% | 1.5% |
| Standard Deviation (Sample) | 9.9% | 1.8% |
| Standard Deviation (Population) | 9.6% | 1.8% |
Similar Demographics by 7th Grade
Demographics Similar to Immigrants from Bulgaria by 7th Grade
In terms of 7th grade, the demographic groups most similar to Immigrants from Bulgaria are Immigrants from Switzerland (96.5%, a difference of 0.010%), Palestinian (96.4%, a difference of 0.010%), Immigrants from Europe (96.5%, a difference of 0.020%), Immigrants from France (96.5%, a difference of 0.020%), and Immigrants from Bosnia and Herzegovina (96.4%, a difference of 0.020%).
| Demographics | Rating | Rank | 7th Grade |
| Immigrants | Japan | 95.5 /100 | #118 | Exceptional 96.5% |
| Immigrants | Norway | 95.2 /100 | #119 | Exceptional 96.5% |
| Immigrants | Croatia | 95.0 /100 | #120 | Exceptional 96.5% |
| Cheyenne | 94.9 /100 | #121 | Exceptional 96.5% |
| Immigrants | Europe | 94.8 /100 | #122 | Exceptional 96.5% |
| Immigrants | France | 94.7 /100 | #123 | Exceptional 96.5% |
| Immigrants | Switzerland | 94.5 /100 | #124 | Exceptional 96.5% |
| Immigrants | Bulgaria | 94.0 /100 | #125 | Exceptional 96.4% |
| Palestinians | 93.5 /100 | #126 | Exceptional 96.4% |
| Immigrants | Bosnia and Herzegovina | 93.3 /100 | #127 | Exceptional 96.4% |
| Immigrants | Romania | 93.2 /100 | #128 | Exceptional 96.4% |
| Immigrants | North Macedonia | 93.1 /100 | #129 | Exceptional 96.4% |
| Immigrants | Serbia | 92.8 /100 | #130 | Exceptional 96.4% |
| Filipinos | 92.1 /100 | #131 | Exceptional 96.4% |
| Colville | 91.7 /100 | #132 | Exceptional 96.4% |
Demographics Similar to Americans by 7th Grade
In terms of 7th grade, the demographic groups most similar to Americans are Russian (97.0%, a difference of 0.0%), Serbian (97.0%, a difference of 0.0%), White/Caucasian (97.0%, a difference of 0.010%), Macedonian (97.0%, a difference of 0.010%), and Australian (97.0%, a difference of 0.020%).
| Demographics | Rating | Rank | 7th Grade |
| Immigrants | Scotland | 99.9 /100 | #50 | Exceptional 97.1% |
| Estonians | 99.9 /100 | #51 | Exceptional 97.0% |
| Greeks | 99.9 /100 | #52 | Exceptional 97.0% |
| Austrians | 99.8 /100 | #53 | Exceptional 97.0% |
| Australians | 99.8 /100 | #54 | Exceptional 97.0% |
| Russians | 99.8 /100 | #55 | Exceptional 97.0% |
| Serbians | 99.8 /100 | #56 | Exceptional 97.0% |
| Americans | 99.8 /100 | #57 | Exceptional 97.0% |
| Whites/Caucasians | 99.8 /100 | #58 | Exceptional 97.0% |
| Macedonians | 99.8 /100 | #59 | Exceptional 97.0% |
| Immigrants | Canada | 99.8 /100 | #60 | Exceptional 96.9% |
| Creek | 99.8 /100 | #61 | Exceptional 96.9% |
| Immigrants | North America | 99.8 /100 | #62 | Exceptional 96.9% |
| Immigrants | Northern Europe | 99.7 /100 | #63 | Exceptional 96.9% |
| Immigrants | Austria | 99.7 /100 | #64 | Exceptional 96.9% |