Immigrants from Brazil vs Sri Lankan 2nd Grade
COMPARE
Immigrants from Brazil
Sri Lankan
2nd Grade
2nd Grade Comparison
Immigrants from Brazil
Sri Lankans
97.9%
2ND GRADE
46.6/ 100
METRIC RATING
177th/ 347
METRIC RANK
96.8%
2ND GRADE
0.0/ 100
METRIC RATING
310th/ 347
METRIC RANK
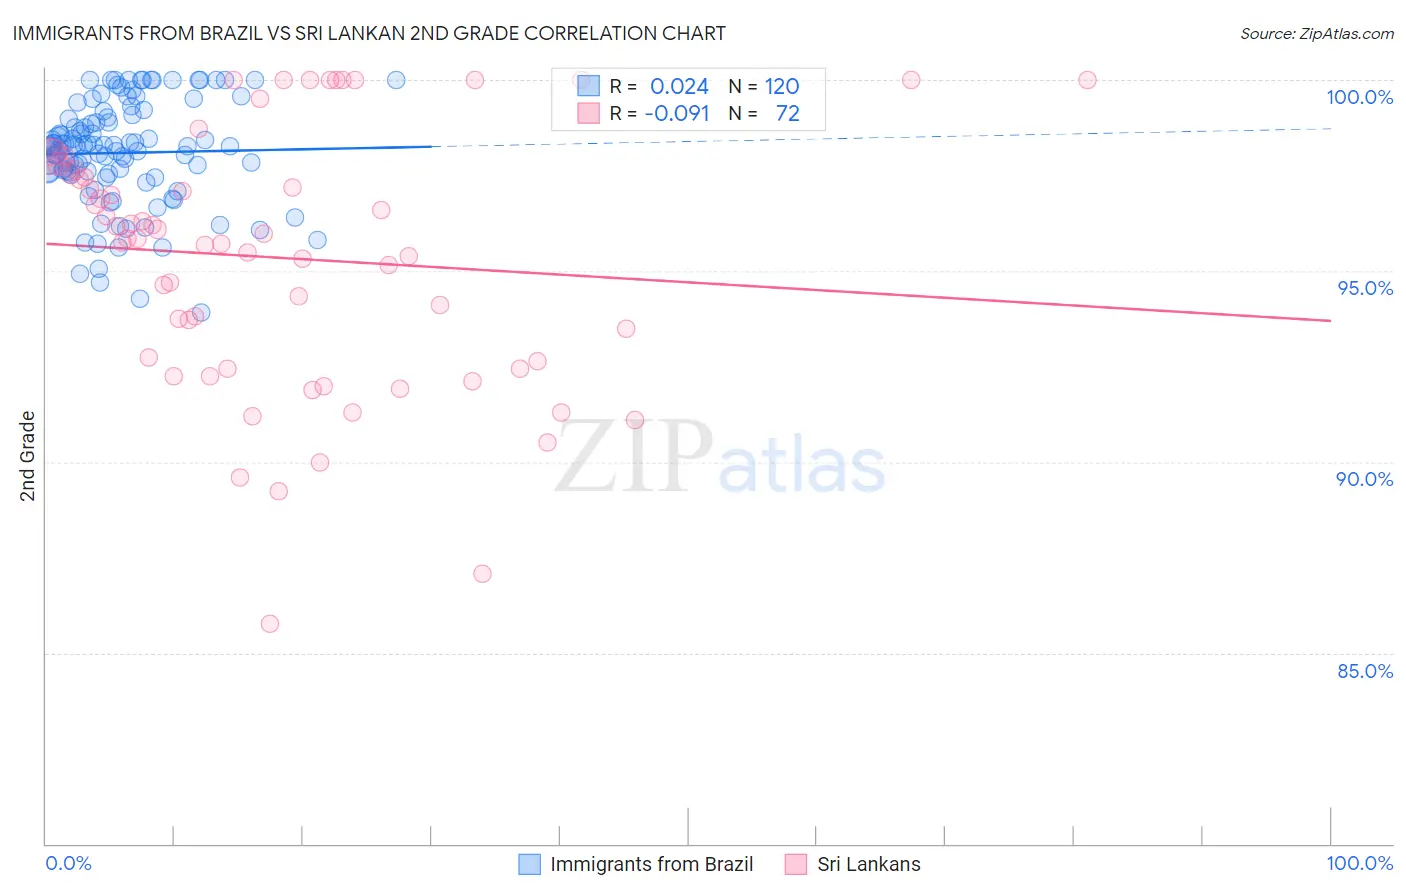
Immigrants from Brazil vs Sri Lankan 2nd Grade Correlation Chart
The statistical analysis conducted on geographies consisting of 343,021,580 people shows no correlation between the proportion of Immigrants from Brazil and percentage of population with at least 2nd grade education in the United States with a correlation coefficient (R) of 0.024 and weighted average of 97.9%. Similarly, the statistical analysis conducted on geographies consisting of 440,593,746 people shows a slight negative correlation between the proportion of Sri Lankans and percentage of population with at least 2nd grade education in the United States with a correlation coefficient (R) of -0.091 and weighted average of 96.8%, a difference of 1.1%.
2nd Grade Correlation Summary
| Measurement | Immigrants from Brazil | Sri Lankan |
| Minimum | 93.9% | 85.8% |
| Maximum | 100.0% | 100.0% |
| Range | 6.1% | 14.2% |
| Mean | 98.1% | 95.3% |
| Median | 98.3% | 95.8% |
| Interquartile 25% (IQ1) | 97.6% | 92.5% |
| Interquartile 75% (IQ3) | 99.0% | 97.6% |
| Interquartile Range (IQR) | 1.4% | 5.1% |
| Standard Deviation (Sample) | 1.4% | 3.4% |
| Standard Deviation (Population) | 1.4% | 3.3% |
Similar Demographics by 2nd Grade
Demographics Similar to Immigrants from Brazil by 2nd Grade
In terms of 2nd grade, the demographic groups most similar to Immigrants from Brazil are Argentinean (97.9%, a difference of 0.0%), Immigrants from Venezuela (97.9%, a difference of 0.0%), Immigrants from Micronesia (97.9%, a difference of 0.010%), Immigrants from Bosnia and Herzegovina (97.9%, a difference of 0.010%), and Immigrants from Sri Lanka (97.9%, a difference of 0.010%).
| Demographics | Rating | Rank | 2nd Grade |
| Navajo | 54.3 /100 | #170 | Average 97.9% |
| Albanians | 52.8 /100 | #171 | Average 97.9% |
| Immigrants | Korea | 52.7 /100 | #172 | Average 97.9% |
| Kenyans | 52.7 /100 | #173 | Average 97.9% |
| Immigrants | Micronesia | 50.0 /100 | #174 | Average 97.9% |
| Immigrants | Bosnia and Herzegovina | 49.8 /100 | #175 | Average 97.9% |
| Immigrants | Sri Lanka | 48.7 /100 | #176 | Average 97.9% |
| Immigrants | Brazil | 46.6 /100 | #177 | Average 97.9% |
| Argentineans | 46.3 /100 | #178 | Average 97.9% |
| Immigrants | Venezuela | 46.1 /100 | #179 | Average 97.9% |
| Natives/Alaskans | 44.3 /100 | #180 | Average 97.9% |
| Egyptians | 44.3 /100 | #181 | Average 97.9% |
| Portuguese | 42.4 /100 | #182 | Average 97.8% |
| Immigrants | Poland | 42.2 /100 | #183 | Average 97.8% |
| Immigrants | Belarus | 41.5 /100 | #184 | Average 97.8% |
Demographics Similar to Sri Lankans by 2nd Grade
In terms of 2nd grade, the demographic groups most similar to Sri Lankans are Belizean (96.8%, a difference of 0.0%), Immigrants from Haiti (96.8%, a difference of 0.010%), Guyanese (96.8%, a difference of 0.010%), Cape Verdean (96.8%, a difference of 0.010%), and Immigrants from the Azores (96.8%, a difference of 0.020%).
| Demographics | Rating | Rank | 2nd Grade |
| Ecuadorians | 0.0 /100 | #303 | Tragic 96.9% |
| Immigrants | Caribbean | 0.0 /100 | #304 | Tragic 96.9% |
| Nicaraguans | 0.0 /100 | #305 | Tragic 96.9% |
| Immigrants | Somalia | 0.0 /100 | #306 | Tragic 96.9% |
| Immigrants | Azores | 0.0 /100 | #307 | Tragic 96.8% |
| Immigrants | Haiti | 0.0 /100 | #308 | Tragic 96.8% |
| Belizeans | 0.0 /100 | #309 | Tragic 96.8% |
| Sri Lankans | 0.0 /100 | #310 | Tragic 96.8% |
| Guyanese | 0.0 /100 | #311 | Tragic 96.8% |
| Cape Verdeans | 0.0 /100 | #312 | Tragic 96.8% |
| Hispanics or Latinos | 0.0 /100 | #313 | Tragic 96.8% |
| Immigrants | Ecuador | 0.0 /100 | #314 | Tragic 96.8% |
| Immigrants | Belize | 0.0 /100 | #315 | Tragic 96.8% |
| Hondurans | 0.0 /100 | #316 | Tragic 96.7% |
| Immigrants | Laos | 0.0 /100 | #317 | Tragic 96.7% |