Immigrants from Brazil vs Haitian 2nd Grade
COMPARE
Immigrants from Brazil
Haitian
2nd Grade
2nd Grade Comparison
Immigrants from Brazil
Haitians
97.9%
2ND GRADE
46.6/ 100
METRIC RATING
177th/ 347
METRIC RANK
97.0%
2ND GRADE
0.0/ 100
METRIC RATING
299th/ 347
METRIC RANK
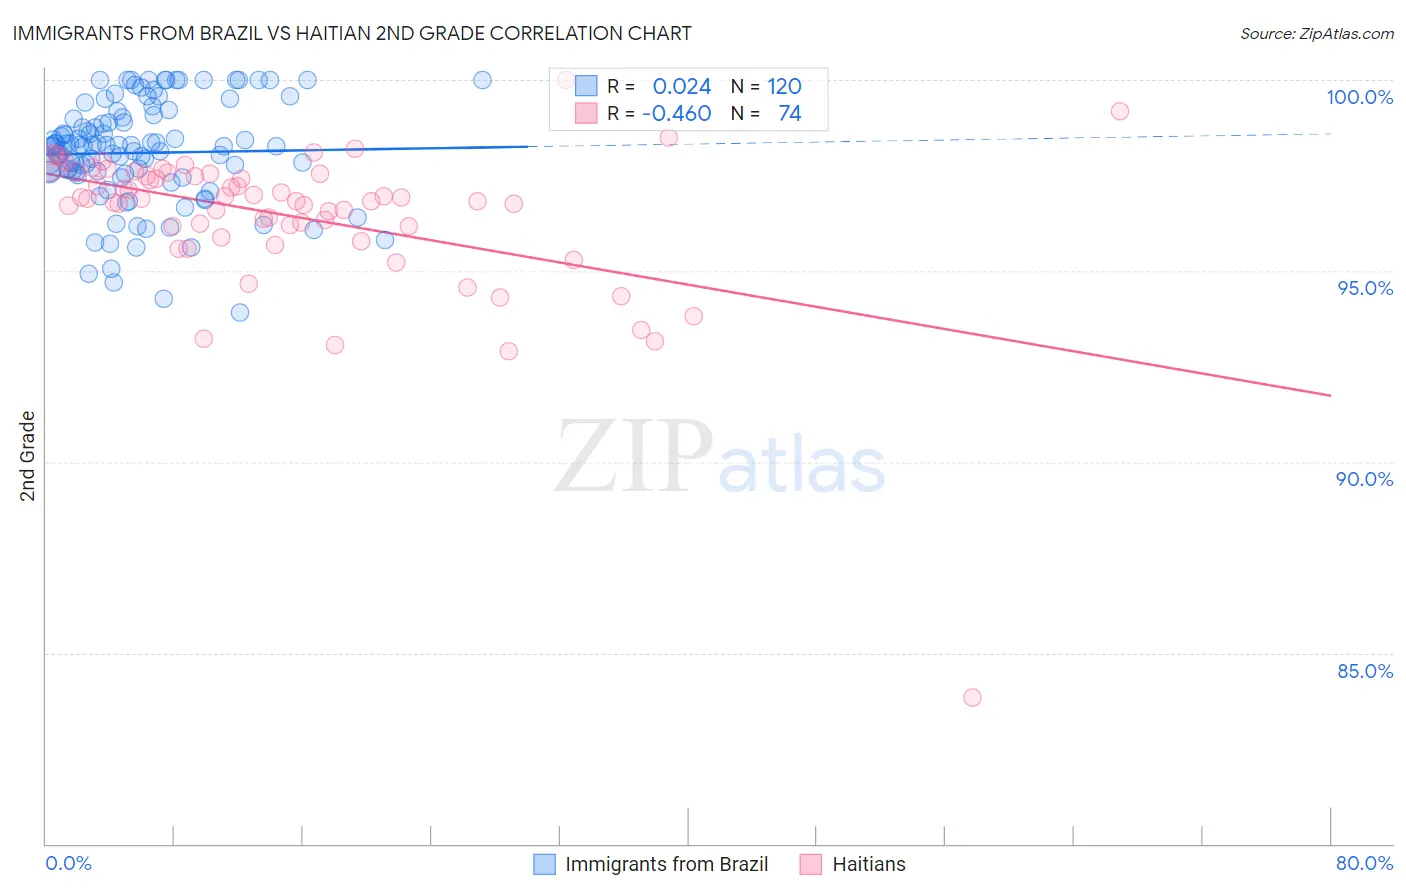
Immigrants from Brazil vs Haitian 2nd Grade Correlation Chart
The statistical analysis conducted on geographies consisting of 343,021,580 people shows no correlation between the proportion of Immigrants from Brazil and percentage of population with at least 2nd grade education in the United States with a correlation coefficient (R) of 0.024 and weighted average of 97.9%. Similarly, the statistical analysis conducted on geographies consisting of 288,018,742 people shows a moderate negative correlation between the proportion of Haitians and percentage of population with at least 2nd grade education in the United States with a correlation coefficient (R) of -0.460 and weighted average of 97.0%, a difference of 0.87%.
2nd Grade Correlation Summary
| Measurement | Immigrants from Brazil | Haitian |
| Minimum | 93.9% | 83.8% |
| Maximum | 100.0% | 100.0% |
| Range | 6.1% | 16.2% |
| Mean | 98.1% | 96.4% |
| Median | 98.3% | 96.9% |
| Interquartile 25% (IQ1) | 97.6% | 96.2% |
| Interquartile 75% (IQ3) | 99.0% | 97.5% |
| Interquartile Range (IQR) | 1.4% | 1.4% |
| Standard Deviation (Sample) | 1.4% | 2.0% |
| Standard Deviation (Population) | 1.4% | 2.0% |
Similar Demographics by 2nd Grade
Demographics Similar to Immigrants from Brazil by 2nd Grade
In terms of 2nd grade, the demographic groups most similar to Immigrants from Brazil are Argentinean (97.9%, a difference of 0.0%), Immigrants from Venezuela (97.9%, a difference of 0.0%), Immigrants from Micronesia (97.9%, a difference of 0.010%), Immigrants from Bosnia and Herzegovina (97.9%, a difference of 0.010%), and Immigrants from Sri Lanka (97.9%, a difference of 0.010%).
| Demographics | Rating | Rank | 2nd Grade |
| Navajo | 54.3 /100 | #170 | Average 97.9% |
| Albanians | 52.8 /100 | #171 | Average 97.9% |
| Immigrants | Korea | 52.7 /100 | #172 | Average 97.9% |
| Kenyans | 52.7 /100 | #173 | Average 97.9% |
| Immigrants | Micronesia | 50.0 /100 | #174 | Average 97.9% |
| Immigrants | Bosnia and Herzegovina | 49.8 /100 | #175 | Average 97.9% |
| Immigrants | Sri Lanka | 48.7 /100 | #176 | Average 97.9% |
| Immigrants | Brazil | 46.6 /100 | #177 | Average 97.9% |
| Argentineans | 46.3 /100 | #178 | Average 97.9% |
| Immigrants | Venezuela | 46.1 /100 | #179 | Average 97.9% |
| Natives/Alaskans | 44.3 /100 | #180 | Average 97.9% |
| Egyptians | 44.3 /100 | #181 | Average 97.9% |
| Portuguese | 42.4 /100 | #182 | Average 97.8% |
| Immigrants | Poland | 42.2 /100 | #183 | Average 97.8% |
| Immigrants | Belarus | 41.5 /100 | #184 | Average 97.8% |
Demographics Similar to Haitians by 2nd Grade
In terms of 2nd grade, the demographic groups most similar to Haitians are Immigrants from Cuba (97.0%, a difference of 0.0%), Immigrants from Dominica (97.0%, a difference of 0.0%), Immigrants from South Eastern Asia (97.0%, a difference of 0.020%), Central American Indian (97.0%, a difference of 0.040%), and Somali (97.0%, a difference of 0.060%).
| Demographics | Rating | Rank | 2nd Grade |
| Immigrants | Eritrea | 0.0 /100 | #292 | Tragic 97.2% |
| British West Indians | 0.0 /100 | #293 | Tragic 97.2% |
| Malaysians | 0.0 /100 | #294 | Tragic 97.1% |
| Immigrants | Grenada | 0.0 /100 | #295 | Tragic 97.1% |
| Immigrants | Immigrants | 0.0 /100 | #296 | Tragic 97.1% |
| Immigrants | Cuba | 0.0 /100 | #297 | Tragic 97.0% |
| Immigrants | Dominica | 0.0 /100 | #298 | Tragic 97.0% |
| Haitians | 0.0 /100 | #299 | Tragic 97.0% |
| Immigrants | South Eastern Asia | 0.0 /100 | #300 | Tragic 97.0% |
| Central American Indians | 0.0 /100 | #301 | Tragic 97.0% |
| Somalis | 0.0 /100 | #302 | Tragic 97.0% |
| Ecuadorians | 0.0 /100 | #303 | Tragic 96.9% |
| Immigrants | Caribbean | 0.0 /100 | #304 | Tragic 96.9% |
| Nicaraguans | 0.0 /100 | #305 | Tragic 96.9% |
| Immigrants | Somalia | 0.0 /100 | #306 | Tragic 96.9% |